Key financial data
First quarter highlights
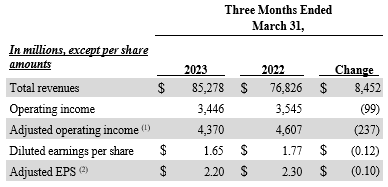
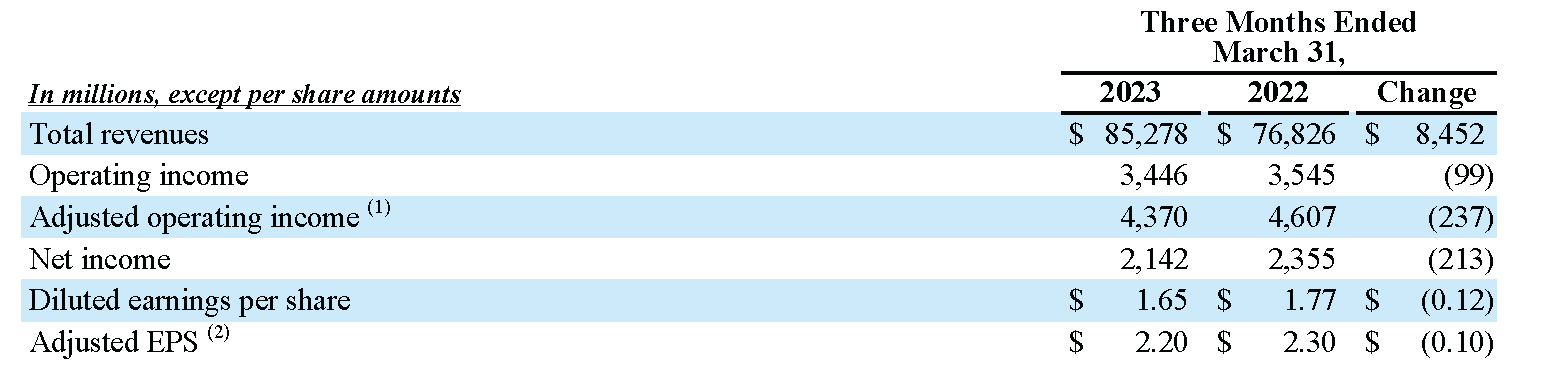
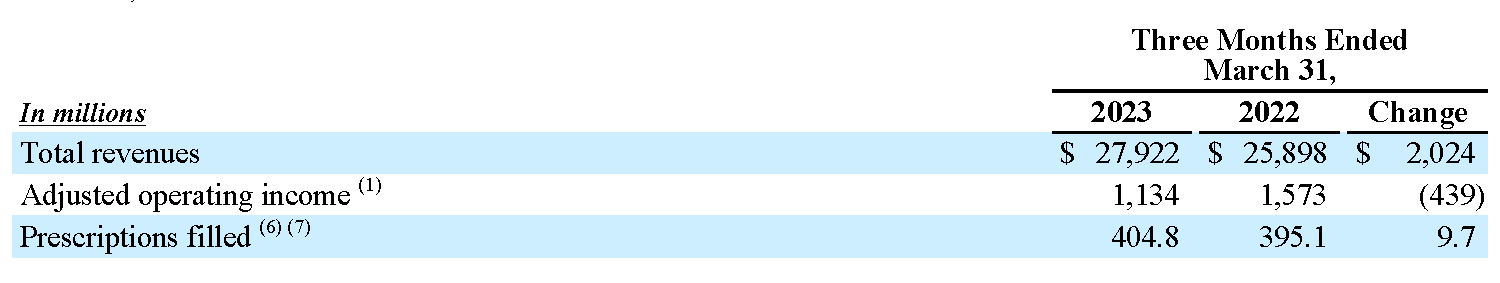
- Total revenues increased to $85.3 billion, up 11.0% compared to prior year
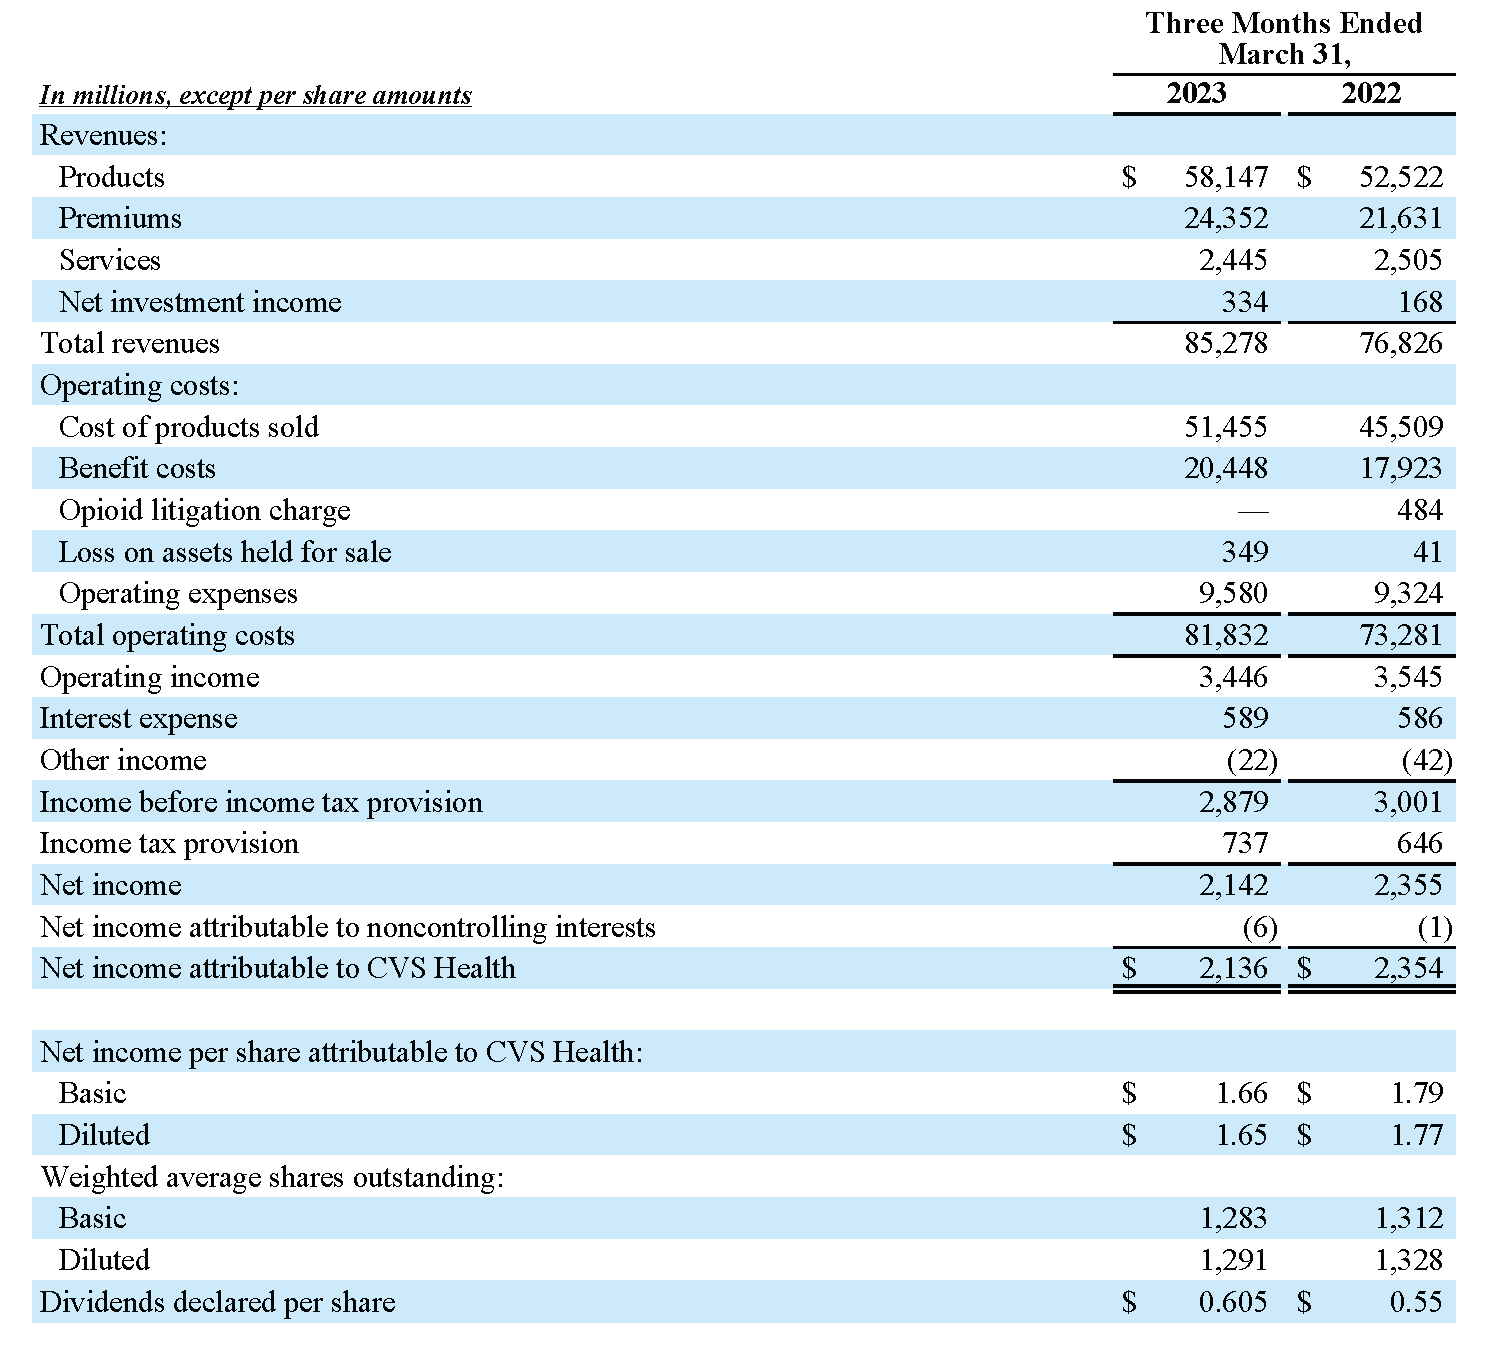
- GAAP diluted EPS of $1.65 and Adjusted EPS of $2.20
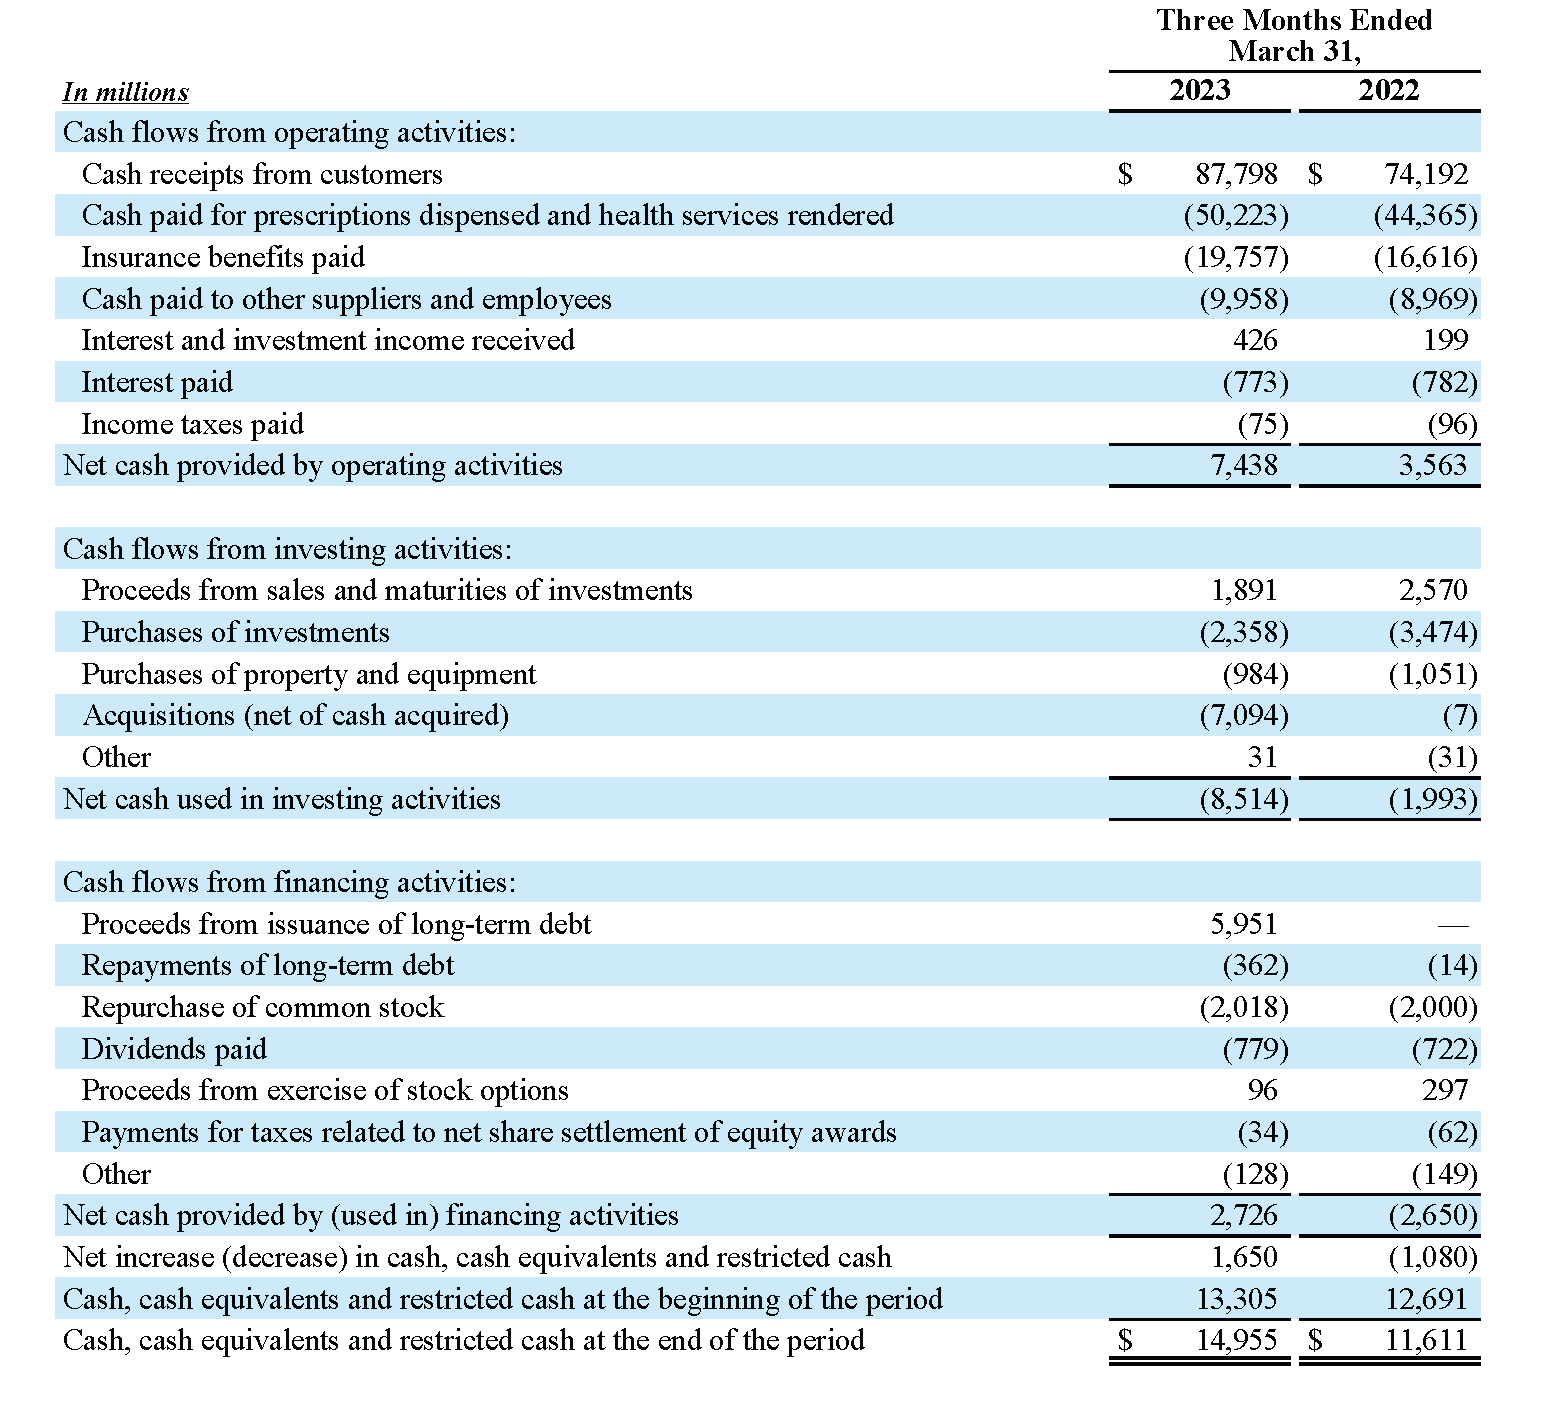
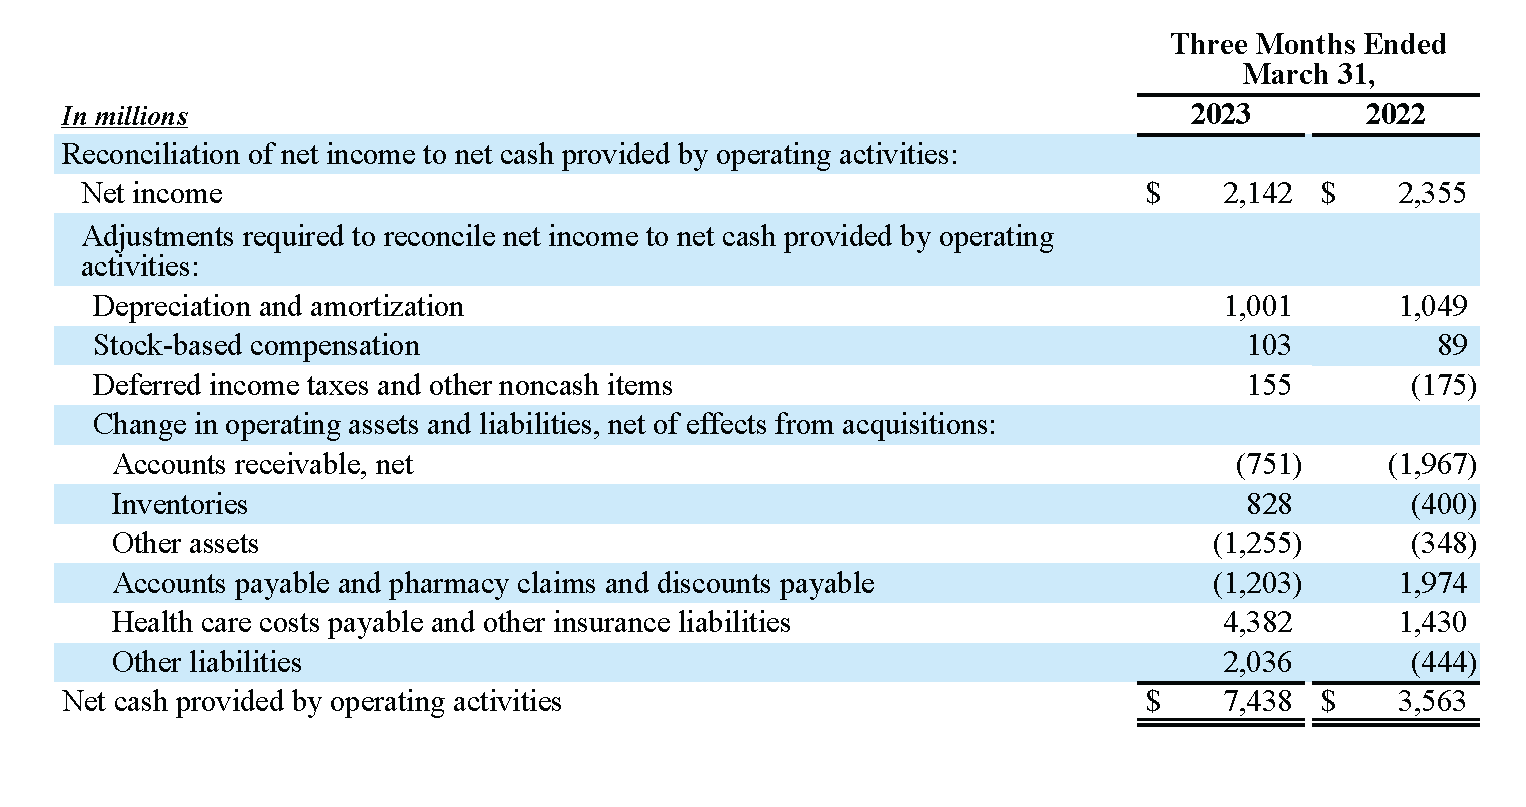
- Generated cash flow from operations of $7.4 billion
Note: Financial information for the three months ended March 31, 2022 throughout this press release has been revised to conform with certain current period financial statement changes as described on page 2
2023 Full-year guidance
- Revised GAAP diluted EPS guidance range to $6.90 to $7.12 from $7.73 to $7.93
- Revised Adjusted EPS guidance range to $8.50 to $8.70 from $8.70 to $8.90
- Confirmed cash flow from operations guidance range of $12.5 billion to $13.5 billion
CEO commentary
“We delivered another strong quarter while executing on the strategy we outlined in December 2021, leading to the close of the Signify Health acquisition followed quickly by Oak Street Health. These additions are core to our strategy and will help unlock future growth as we push further into value-based care, which prioritizes keeping people healthy.”
— Karen S. Lynch, CVS Health President and CEO
In the spotlight
On March 29, 2023, completed the acquisition of Signify Health for approximately $7.8 billion, adding best-in-class capabilities for in-home services and a platform to accelerate growth in value-based care, representing a critical step in advancing the Company’s health care services strategy.
On May 2, 2023, completed the acquisition of Oak Street Health for approximately $10.6 billion, adding a leading multi-payor, value-based primary care company with approximately 600 primary care providers and more than 170 medical centers across 21 states.
Realigned the composition of the Company’s segments including the creation of a Health Services segment, comprised of the Company’s pharmacy benefit management operations, health care services and provider enablement solutions, as well as a Pharmacy & Consumer Wellness segment, comprised of enterprise pharmacy fulfillment and retail front store operations.
Returned $779 million to shareholders through dividends and repurchased 22.8 million shares of common stock
The Company presents both GAAP and non-GAAP financial measures in this press release to assist in the comparison of the Company’s past financial performance with its current financial performance. See “Non-GAAP Financial Information” beginning on page 11 and endnotes beginning on page 23 for explanations of non-GAAP financial measures presented in this press release. See pages 13 through 14 and page 22 for reconciliations of each non-GAAP financial measure used in this release to the most directly comparable GAAP financial measure.
Consolidated first quarter results
Q1 2023 financial statement changes
The Company’s financial information for the three months ended March 31, 2023 reflects the following items:
- Effective for the first quarter of 2023, the Company realigned the composition of its segments to correspond with changes made to its operating model and how the business is managed. As a result of this realignment, the Company formed a new Health Services segment, which in addition to providing a full range of pharmacy benefit management (“PBM”) solutions, also delivers health care services in the Company’s medical clinics, virtually, and in the home, as well as provider enablement solutions. In addition, the Company created a new Pharmacy & Consumer Wellness segment, which includes its retail and long-term care pharmacy operations and related pharmacy services, as well as its retail front store operations. This segment will also provide pharmacy fulfillment services to support the Health Services segment’s specialty and mail order pharmacy offerings. The Company also discontinued its former segment reporting practice for activity under its Maintenance Choice® program as described within the supplemental information beginning on page 15. Following this segment realignment, the Company’s four reportable segments are: Health Care Benefits, Health Services, Pharmacy & Consumer Wellness and Corporate/Other.
- Effective January 1, 2023, the Company adopted a new accounting standard related to the accounting for long- duration insurance contracts using a modified retrospective transition method. Refer to Note 1 ‘‘Significant Accounting Policies’’ in the Company’s Quarterly Report on Form 10-Q for the period ended March 31, 2023 for further information regarding the adoption of this accounting standard.
- Effective for the first quarter of 2023, the impact of net realized capital gains or losses are excluded from adjusted operating income as further described on page 11.
Prior period financial information has been revised to conform with the current period presentation.
Q1 2023 financial results
For the three months ended March 31, 2023 compared to the prior year:
- Total revenues increased 11.0% driven by growth across all segments.
- Operating income decreased 2.8% primarily due to the write-down of the Company’s Omnicare® long-term care business (“LTC business”), the decrease in adjusted operating income described below and an increase in acquisition-related transaction and integration costs compared to the prior year. The decrease in operating income was partially offset by the absence of a $484 million opioid litigation charge recorded in the prior year and a decrease in amortization of intangible assets compared to the prior year.
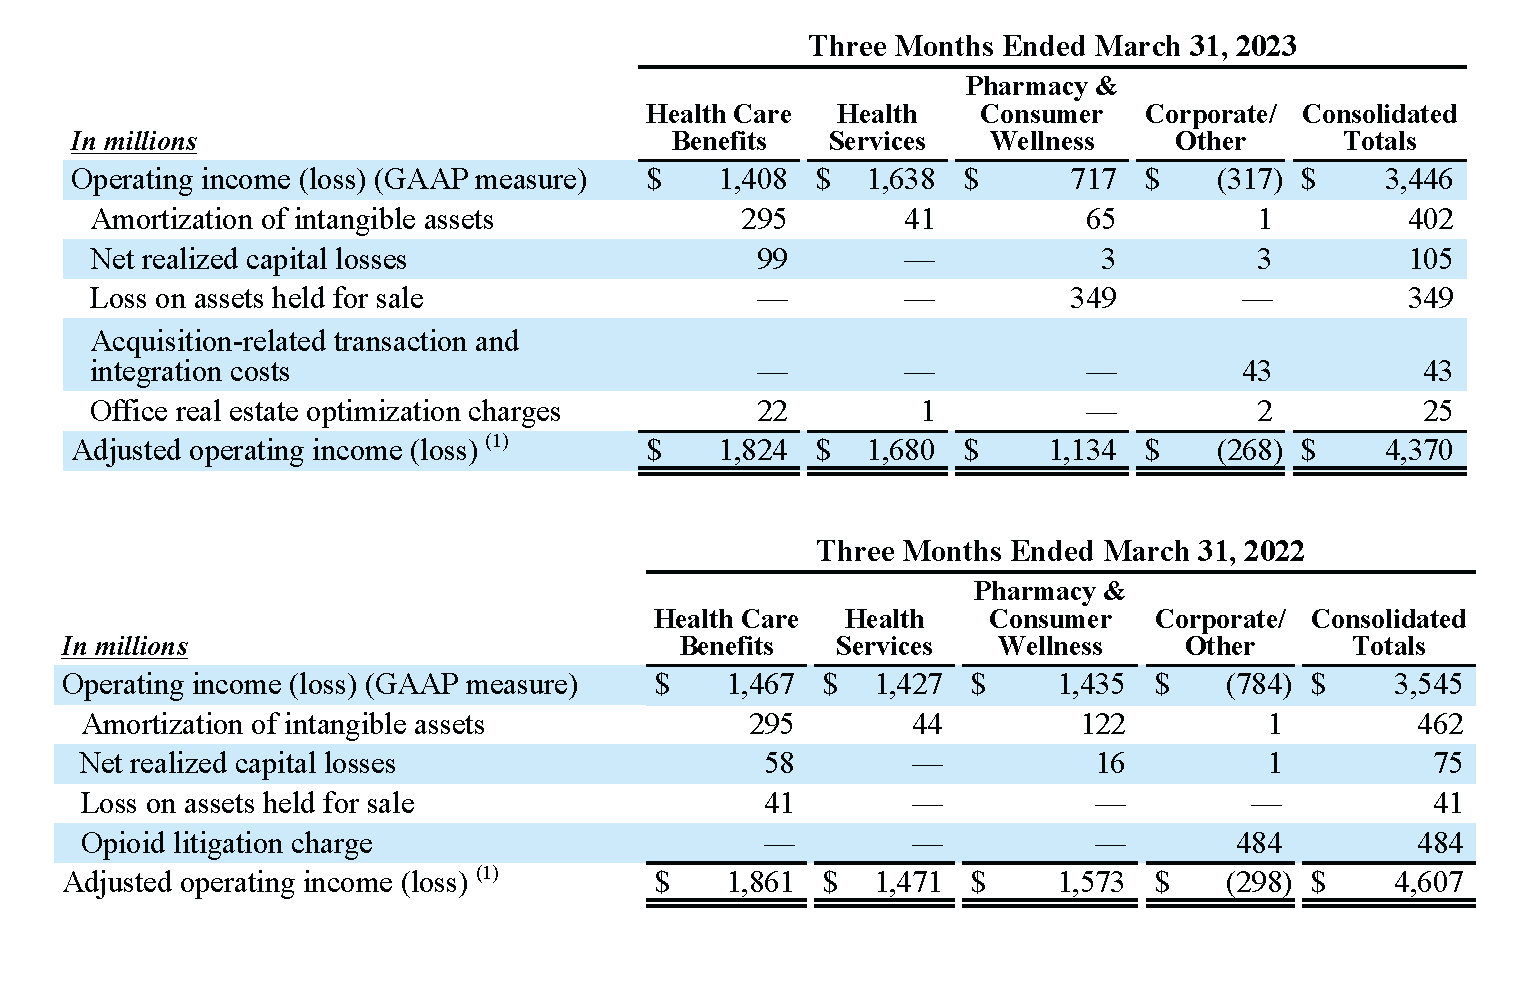
- Adjusted operating income decreased 5.1% primarily driven by declines in the Pharmacy & Consumer Wellness segment, partially offset by increases in the Health Services segment. See pages 3 through 5 for additional discussion of adjusted operating income performance of the Company’s segments.
- Interest expense remained relatively consistent, increasing to $589 million from $586 million.
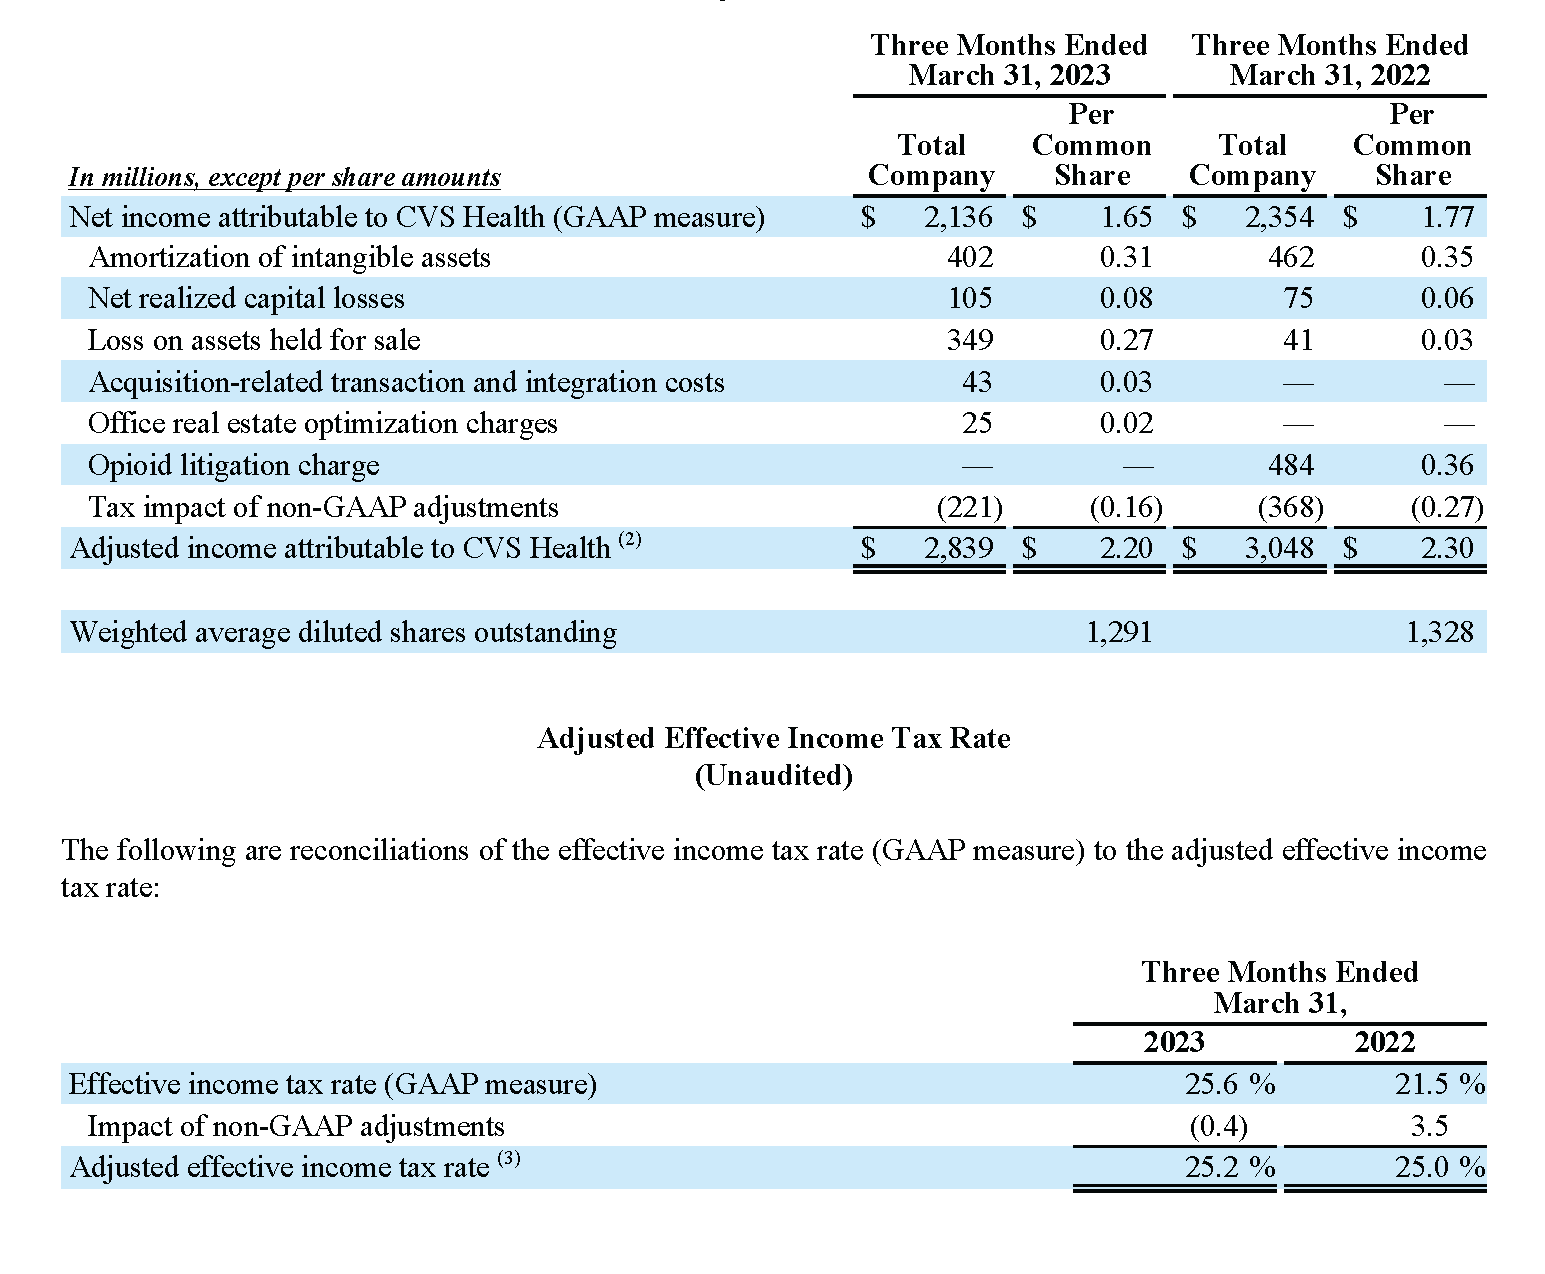
- The effective income tax rate increased to 25.6% compared to 21.5% primarily due to the absence of the impact of certain discrete tax items concluded in the first quarter of 2022. The Company’s adjusted effective income tax rate (3) remained relatively consistent compared to prior year.
Health Care Benefits segment (Unaudited)
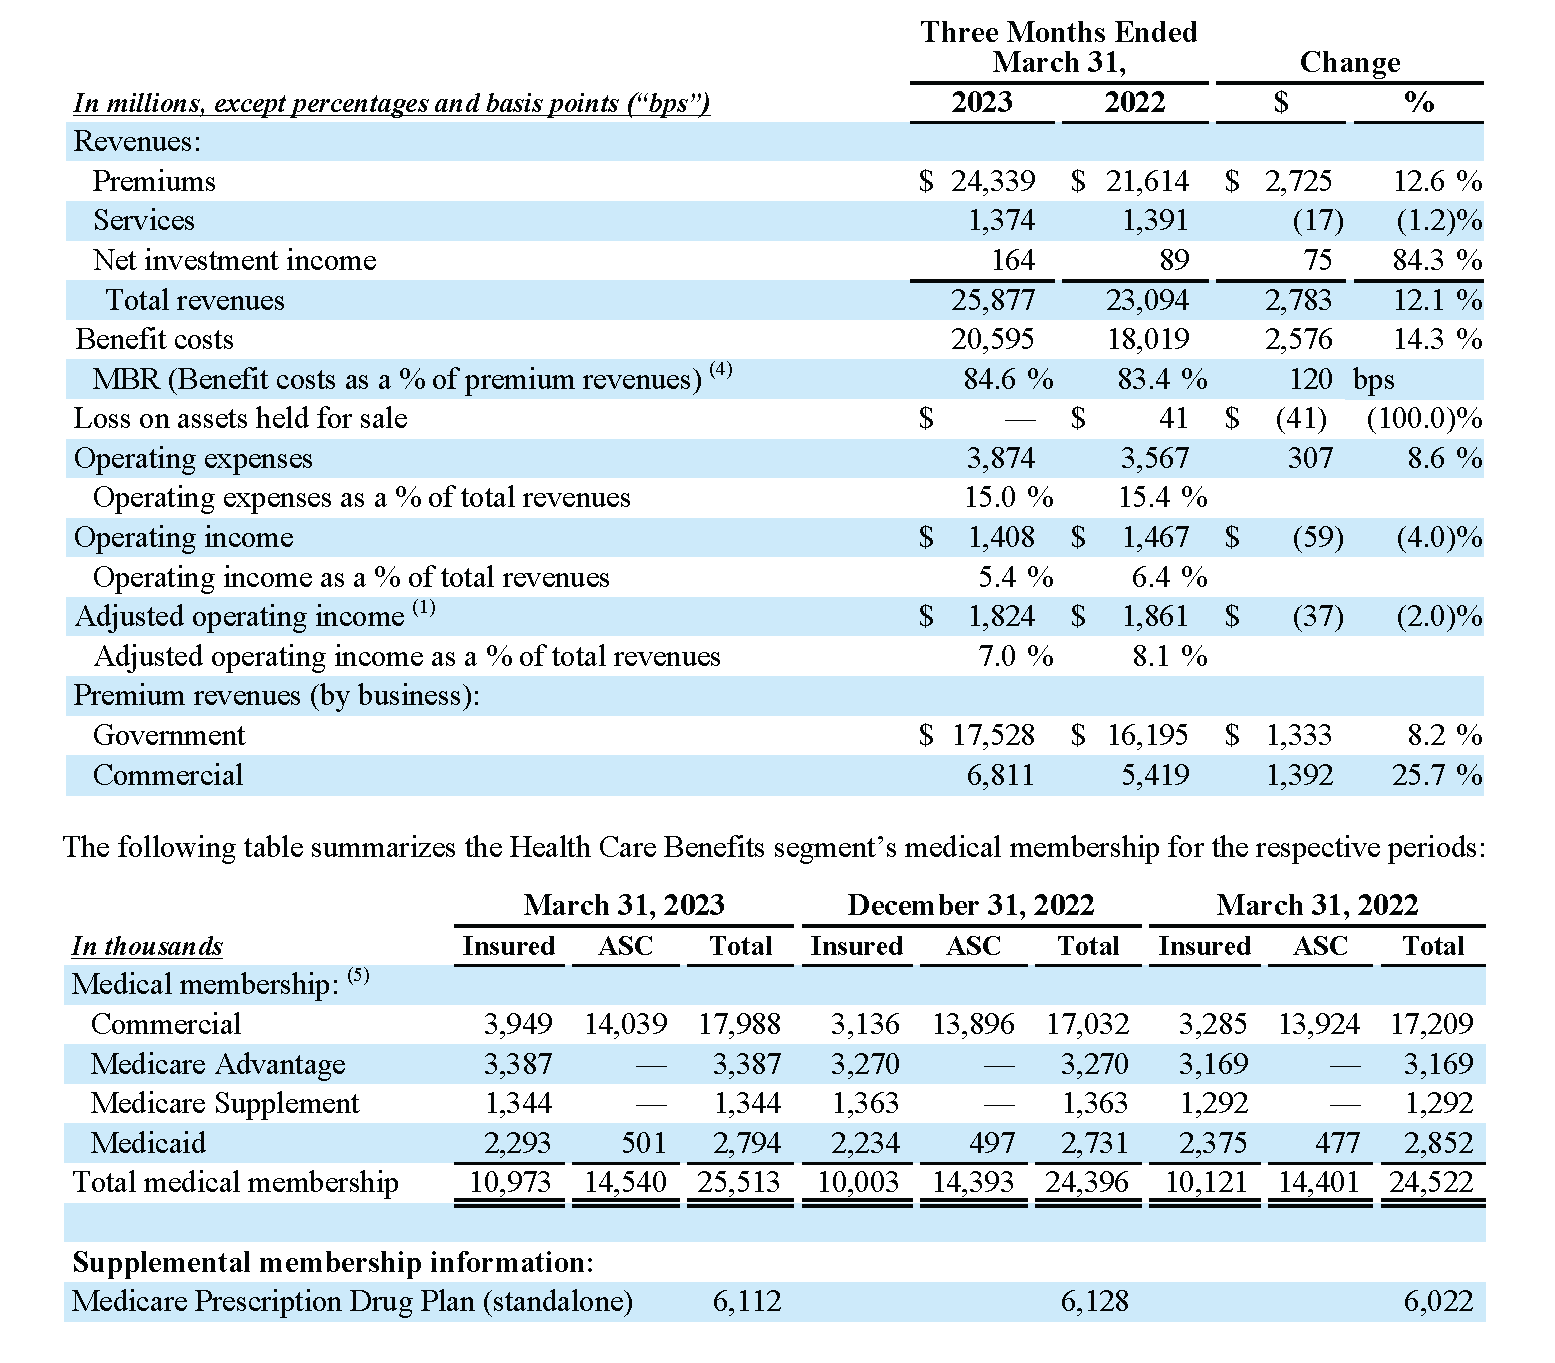
The Health Care Benefits segment offers a full range of insured and self-insured (“ASC”) medical, pharmacy, dental and behavioral health products and services. The segment results for the three months ended March 31, 2023 and 2022 were as follows: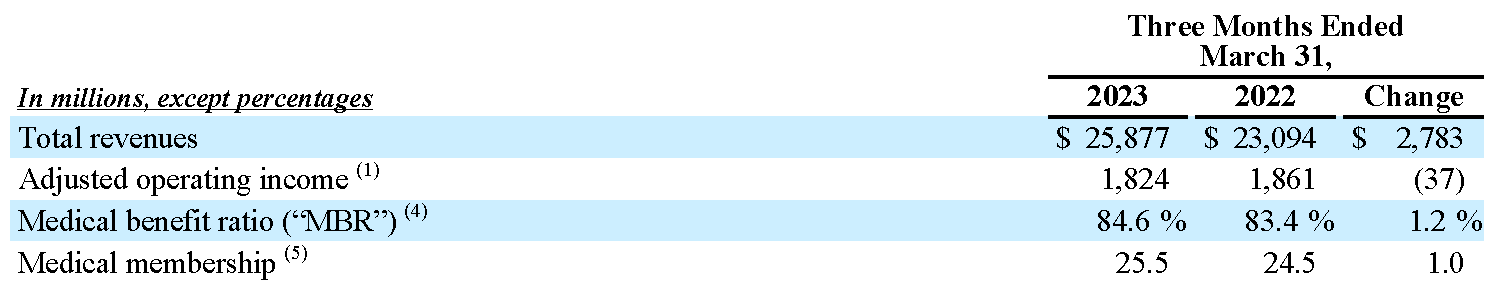
- Total revenues increased 12.1% for the three months ended March 31, 2023 compared to the prior year driven by growth across all product lines.
- Adjusted operating income decreased slightly in the three months ended March 31, 2023 compared to the prior year primarily driven by the continued progression towards normalized utilization and lower impact from favorable development of prior-years’ health care cost estimates in the three months ended March 31, 2023 compared to the prior year. These decreases were largely offset by higher net investment income and membership growth across all product lines in the three months ended March 31, 2023.
- The MBR increased to 84.6% in the three months ended March 31, 2023 compared to 83.4% in the prior year reflective of the continued progression towards normalized utilization and lower impact from favorable development of prior-years’ health care cost estimates in the three months ended March 31, 2023 compared to the prior year.
- Medical membership as of March 31, 2023 of 25.5 million increased 1.1 million members compared with December 31, 2022, reflecting increases across all product lines including an increase of approximately 900,000 members related to the individual exchange business within the Commercial product line.
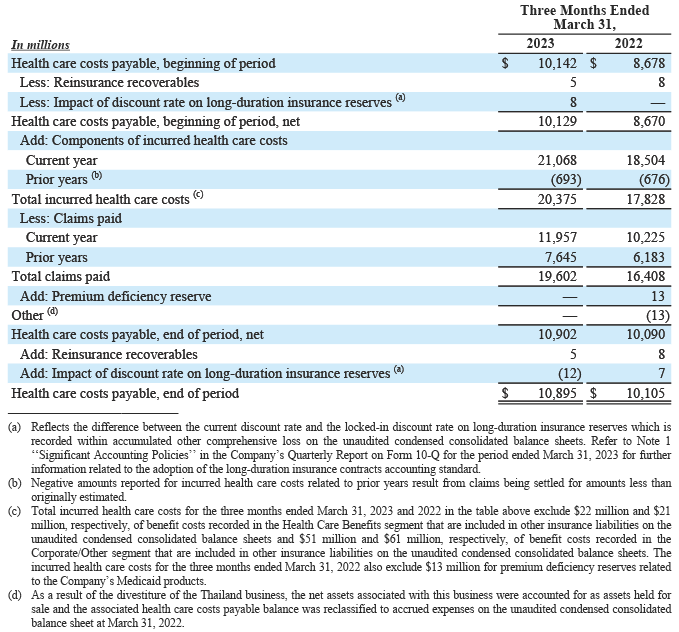
- The segment experienced favorable development of prior-years’ health care cost estimates in its Government Services and Commercial businesses during the three months ended March 31, 2023, primarily attributable to fourth quarter 2022 performance.
- Prior years’ health care costs payable estimates developed favorably by $693 million during the three months ended March 31, 2023. This development is reported on a basis consistent with the prior years’ development reported in the health care costs payable table in the Company’s annual audited financial statements and does not directly correspond to an increase in 2023 operating results.
See the supplemental information on page 17 for additional information regarding the performance of the Health Care Benefits segment.
Health Services segment (formerly Pharmacy Services segment)
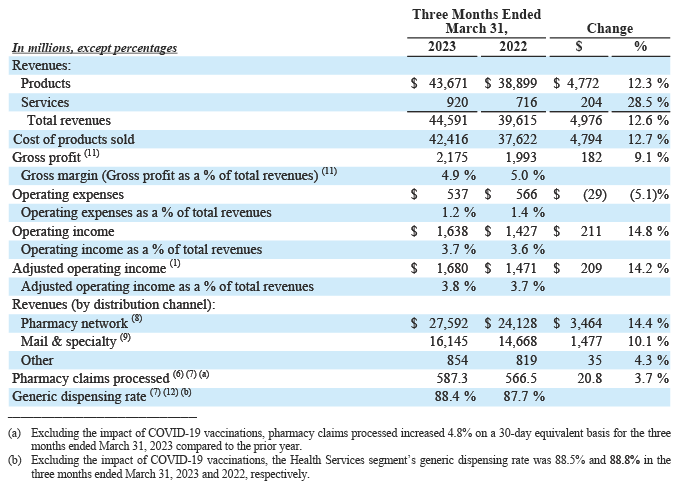
The Health Services segment provides a full range of PBM solutions, delivers health care services in its medical clinics, virtually, and in the home, and offers provider enablement solutions. The segment results for the three months ended March 31, 2023 and 2022 were as follows:
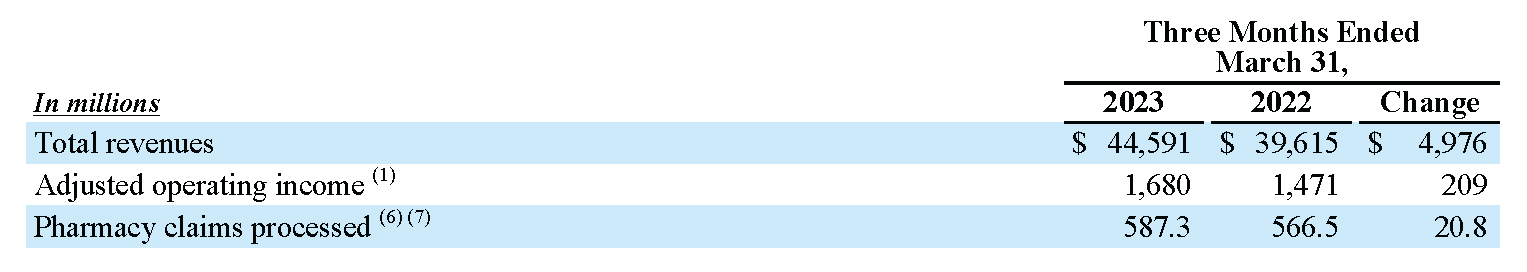
- Total revenues increased 12.6% for the three months ended March 31, 2023 compared to the prior year primarily driven by increased pharmacy claims volume, growth in specialty pharmacy and brand inflation, partially offset by continued pharmacy client price improvements.
- Adjusted operating income increased 14.2% for the three months ended March 31, 2023 compared to the prior year primarily driven by improved purchasing economics, including increased contributions from the products and services of the Company’s group purchasing organization, and increased pharmacy claims volume. These increases were partially offset by continued pharmacy client price improvements and decreased COVID-19 diagnostic testing in the segment’s MinuteClinic® walk-in medical clinics compared to the prior year.
- Pharmacy claims processed increased 3.7% on a 30-day equivalent basis for the three months ended March 31, 2023 compared to the prior year. The increase was primarily driven by net new business, increased utilization and the impact of an elevated cough, cold and flu season compared to the prior year. These increases were partially offset by a decrease in COVID-19 vaccinations. Excluding the impact of COVID-19 vaccinations, pharmacy claims processed increased 4.8% on a 30-day equivalent basis for the three months ended March 31, 2023 compared to the prior year.
- See the supplemental information on page 19 for additional information regarding the performance of the Health Services segment.
See the supplemental information on page 19 for additional information regarding the performance of the Health Services segment.
Pharmacy & Consumer Wellness segment (formerly Retail/LTC segment)
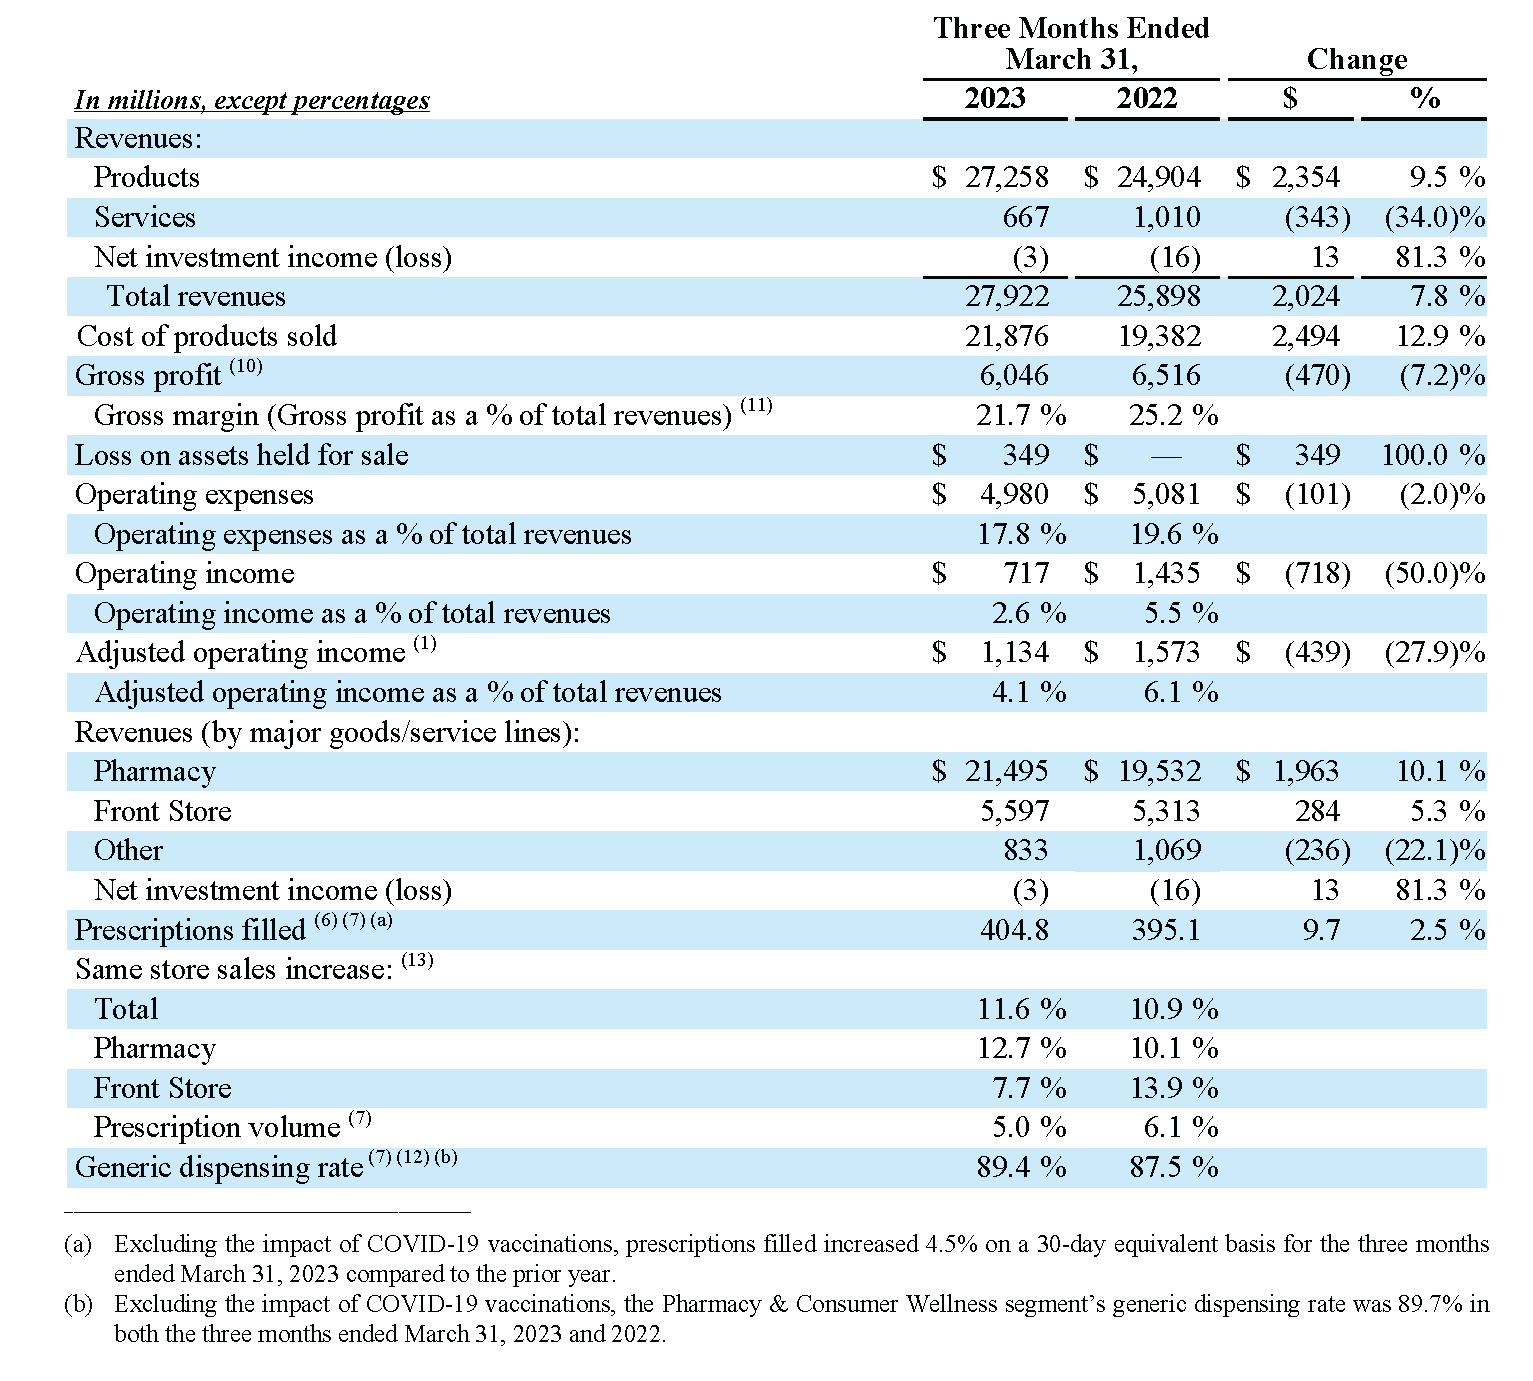
The Pharmacy & Consumer Wellness segment dispenses prescriptions in its retail pharmacies and through its infusion operations, provides ancillary pharmacy services including pharmacy patient care programs, diagnostic testing and vaccination administration, and sells a wide assortment of health and wellness products and general merchandise. The segment also provides pharmacy services to long-term care facilities and pharmacy fulfillment services to support the Health Services segment’s specialty and mail order pharmacy offerings. The segment results for the three months ended March 31, 2023 and 2022 were as follows:
- Total revenues increased 7.8% for the three months ended March 31, 2023 compared to the prior year primarily driven by increased prescription and front store volume, pharmacy drug mix and brand inflation. These increases were partially offset by continued pharmacy reimbursement pressure, decreased COVID-19 vaccinations and diagnostic testing and the impact of recent generic introductions.
- Adjusted operating income decreased 27.9% for the three months ended March 31, 2023 compared to the prior year primarily driven by continued pharmacy reimbursement pressure, decreased COVID-19 vaccinations and diagnostic testing and increased investments in the segment’s operations and capabilities. These decreases were partially offset by the increased prescription volume described above and improved generic drug purchasing.
- Prescriptions filled increased 2.5% on a 30-day equivalent basis for the three months ended March 31, 2023 compared to the prior year primarily driven by increased utilization and the impact of an elevated cough, cold and flu season compared to the prior year. These increases were partially offset by a decrease in COVID-19 vaccinations. Excluding the impact of COVID-19 vaccinations, prescriptions filled increased 4.5% on a 30-day equivalent basis for the three months ended March 31, 2023 compared to the prior year.
See the supplemental information on page 20 for additional information regarding the performance of the Pharmacy & Consumer Wellness segment.
2023 full-year guidance
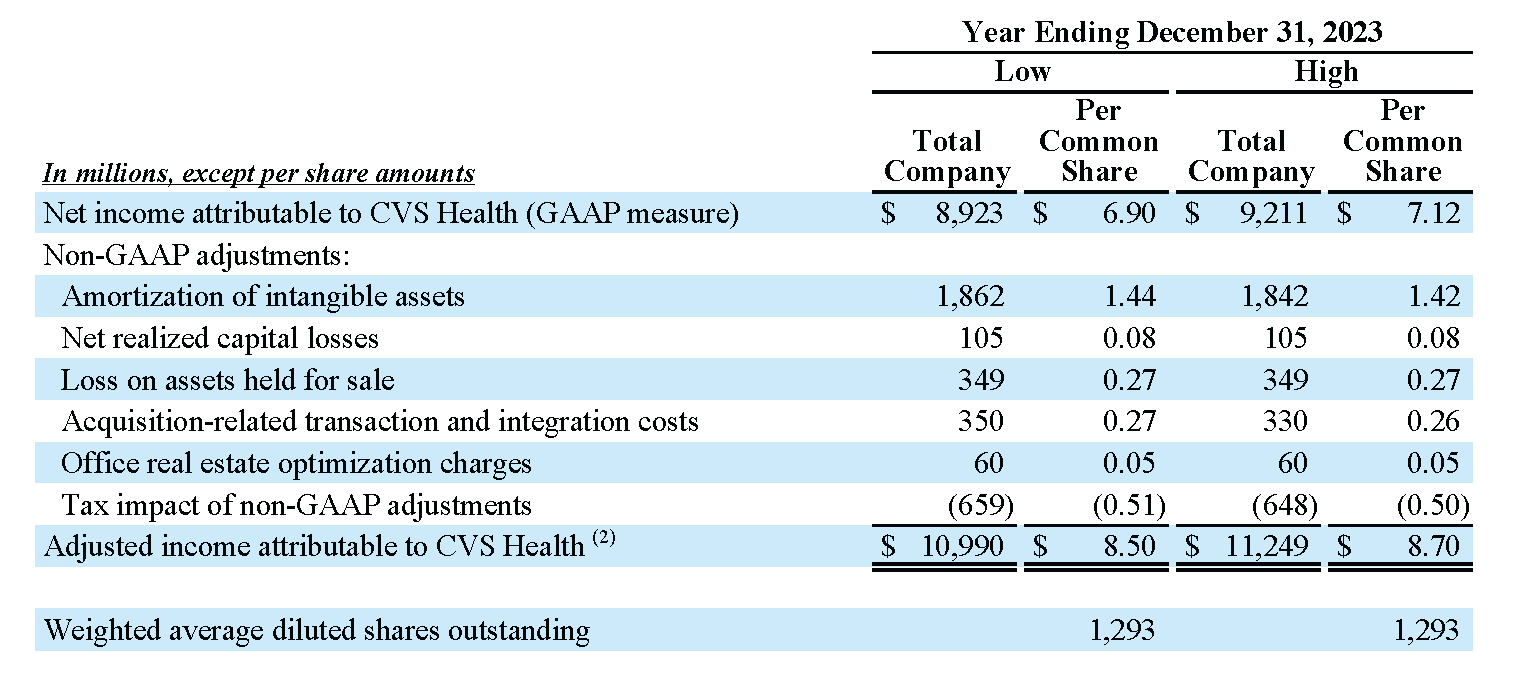
The Company revised its full-year 2023 GAAP diluted EPS guidance range to $6.90 to $7.12 from $7.73 to $7.93 and its full-year 2023 Adjusted EPS guidance range to $8.50 to $8.70 from $8.70 to $8.90. The Company also confirmed its full-year 2023 cash flow from operations guidance range of $12.5 billion to $13.5 billion.
The adjustments between full-year 2023 GAAP diluted EPS and Adjusted EPS include amortization of intangible assets, net realized capital losses, a loss on assets held for sale, acquisition-related transaction and integration costs related to the acquisitions of Signify Health, Inc. (“Signify Health”) and Oak Street Health, Inc. (“Oak Street Health”), office real estate optimization charges and the corresponding income tax benefit or expense related to the items excluded from adjusted income attributable to CVS Health.
Teleconference and Webcast
The Company will be holding a conference call today for investors at 8:00 a.m. (Eastern Time) to discuss its first quarter results. An audio webcast of the call will be broadcast simultaneously for all interested parties through the Investor Relations section of the CVS Health website at http://investors.cvshealth.com. This webcast will be archived and available on the website for a one-year period following the conference call.
About CVS Health
CVS Health® is the leading health solutions company, delivering care like no one else can. We reach more people and improve the health of communities across America through our local presence, digital channels and over 300,000 dedicated colleagues – including more than 40,000 physicians, pharmacists, nurses, and nurse practitioners. Wherever and whenever people need us, we help them with their health – whether that’s managing chronic diseases, staying compliant with their medications or accessing affordable health and wellness services in the most convenient ways. We help people navigate the health care system – and their personal health care – by improving access, lowering costs and being a trusted partner for every meaningful moment of health. And we do it all with heart, each and every day. Follow @CVSHealth on social media.
Cautionary statement concerning forward-looking statements
The Private Securities Litigation Reform Act of 1995 provides a safe harbor for forward-looking statements made by or on behalf of CVS Health Corporation. Statements in this press release that are forward-looking include, but are not limited to, Ms. Lynch’s quotation, the information under the headings “2023 Full-Year Guidance” and “In The Spotlight” and the information included in the reconciliations and endnotes. By their nature, all forward- looking statements are not guarantees of future performance or results and are subject to risks and uncertainties that are difficult to predict and/or quantify. Actual results may differ materially from those contemplated by the forward- looking statements due to the risks and uncertainties related to the impact of COVID-19 and CVS Health’s acquisitions of Signify Health and Oak Street Health as well as additional risks and uncertainties as described in our Securities and Exchange Commission (“SEC”) filings, including those set forth in the Risk Factors section and under the heading “Cautionary Statement Concerning Forward-Looking Statements” in our most recently filed Annual Report on Form 10-K, our Quarterly Report on Form 10-Q for the quarterly period ended March 31, 2023 and our Current Reports on Form 8-K.
You are cautioned not to place undue reliance on CVS Health’s forward-looking statements. CVS Health’s forward- looking statements are and will be based upon management’s then-current views and assumptions regarding future events and operating performance, and are applicable only as of the dates of such statements. CVS Health does not assume any duty to update or revise forward-looking statements, whether as a result of new information, future events, uncertainties or otherwise.
– Tables Follow –
CVS Health Corporation
Condensed consolidated statements of operations
(Unaudited)
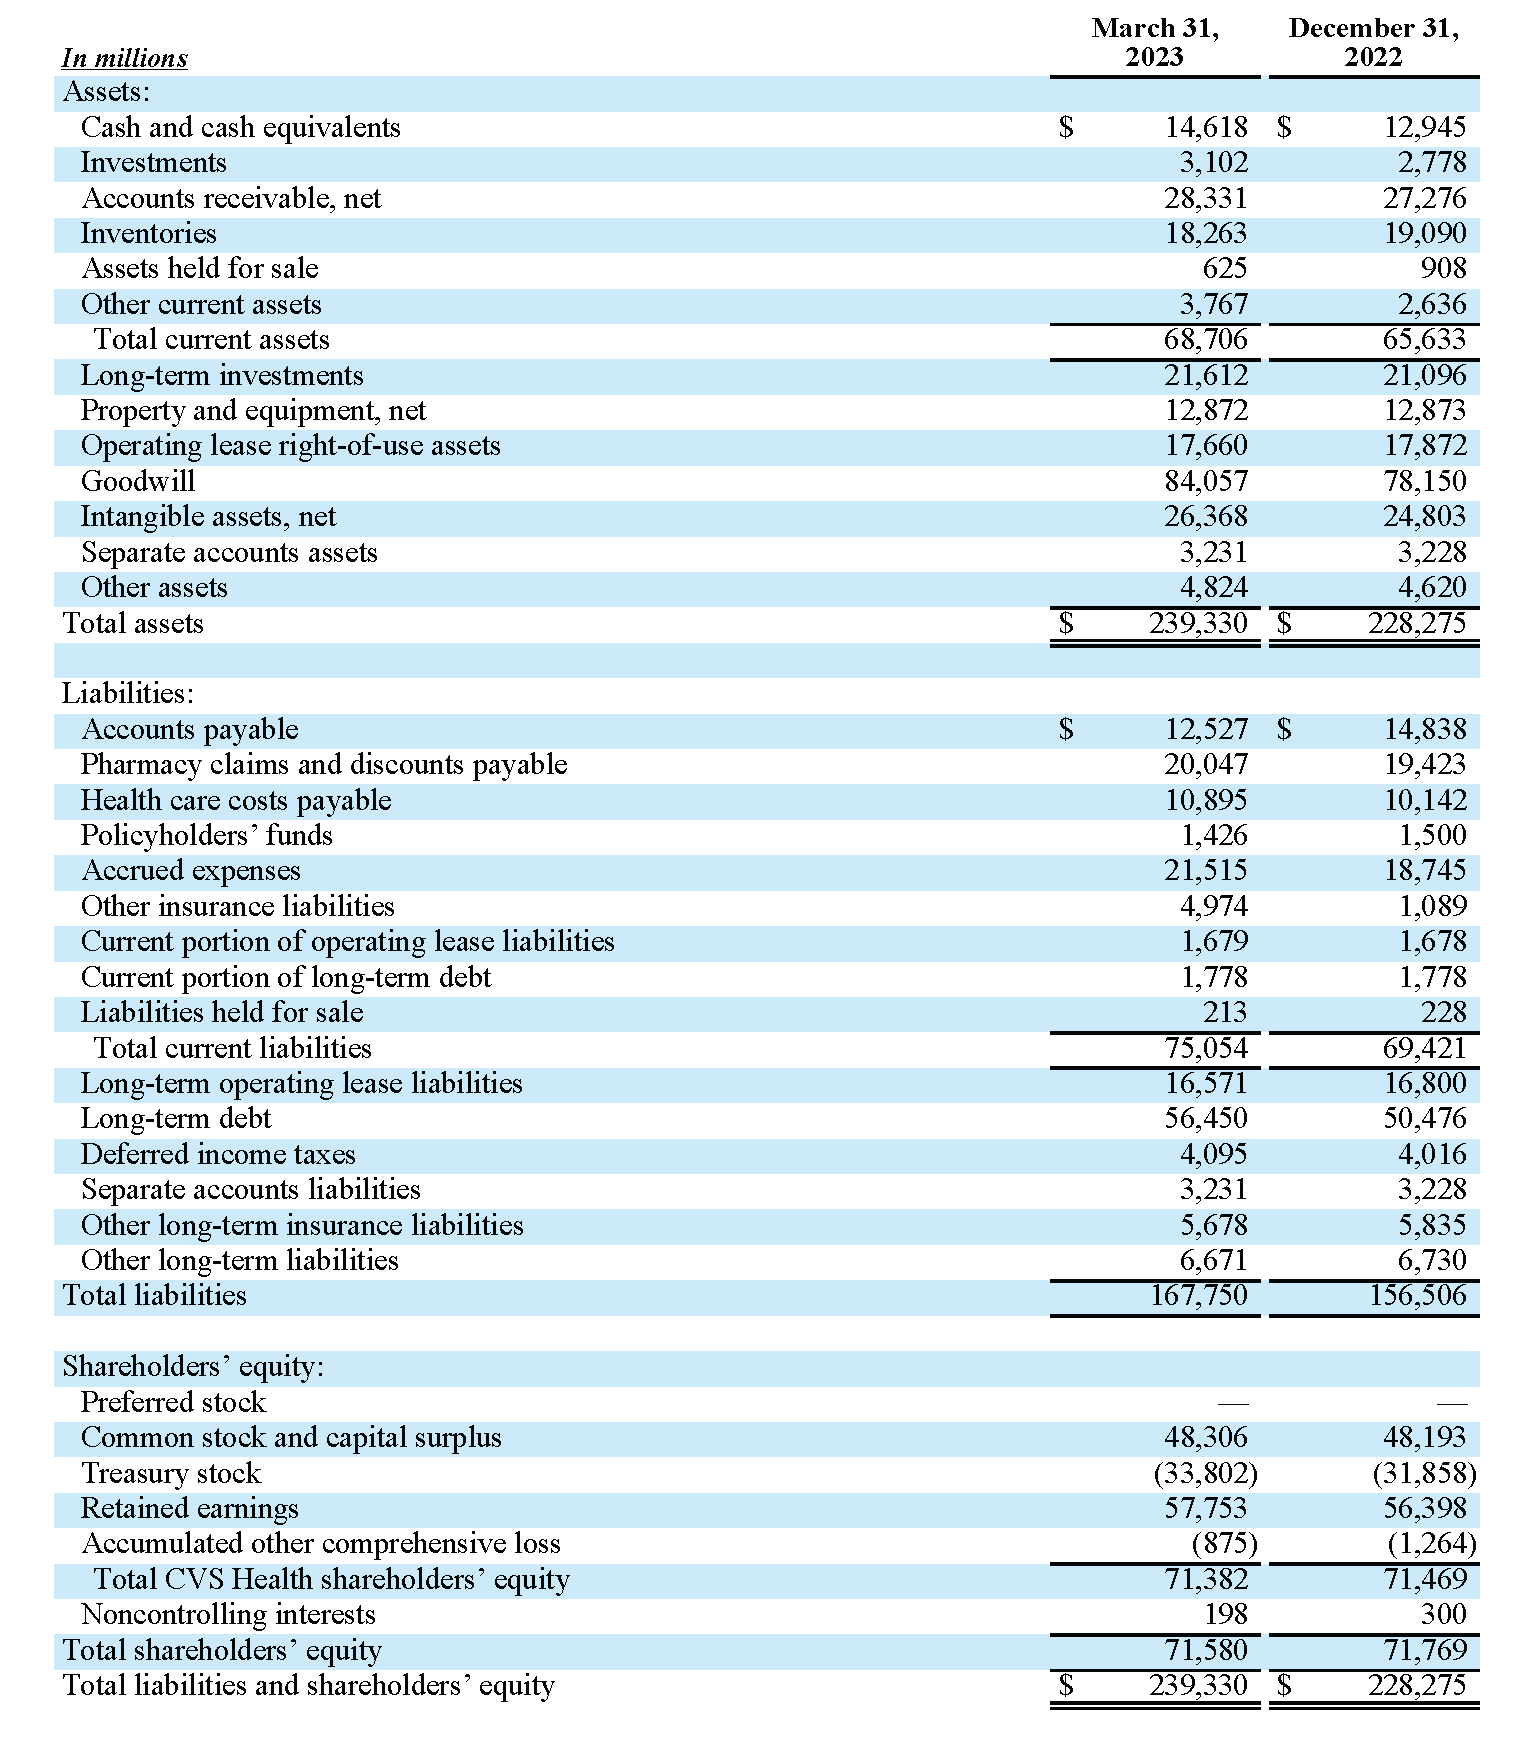
CVS Health Corporation
Condensed consolidated balance sheets
(Unaudited)
CVS Health Corporation
Condensed consolidated statements of cash flows
(Unaudited)
CVS Health Corporation
Condensed consolidated statements of cash flows
(Unaudited)
Non-GAAP financial information
The Company uses non-GAAP financial measures to analyze underlying business performance and trends. The Company believes that providing these non-GAAP financial measures enhances the Company’s and investors’ ability to compare the Company’s past financial performance with its current performance. These non-GAAP financial measures are provided as supplemental information to the financial measures presented in this press release that are calculated and presented in accordance with GAAP. Non-GAAP financial measures should not be considered a substitute for, or superior to, financial measures determined or calculated in accordance with GAAP. The Company’s definitions of its non-GAAP financial measures may not be comparable to similarly titled measures reported by other companies.
Non-GAAP financial measures such as consolidated adjusted operating income, adjusted earnings per share (“EPS”) and adjusted income attributable to CVS Health exclude from the relevant GAAP metrics, as applicable: amortization of intangible assets and other items, if any, that neither relate to the ordinary course of the Company’s business nor reflect the Company’s underlying business performance. Effective January 1, 2023, the Company’s non-GAAP financial measures also exclude the impact of net realized capital gains or losses, described in further detail below. Prior period financial information throughout this press release has been revised to conform with the current period presentation.
The Company’s Non-GAAP adjusted effective income tax rate excludes from the relevant GAAP metric the corresponding tax benefit or expense related to the amortization of intangible assets, net realized capital gains or losses and other items, if any, that neither relate to the ordinary course of the Company’s business nor reflect the Company’s underlying business performance and certain discrete tax items.
For the periods covered in this press release, the following items are excluded from the non-GAAP financial measures described above, as applicable, because the Company believes they neither relate to the ordinary course of the Company’s business nor reflect the Company’s underlying business performance:
- The Company’s acquisition activities have resulted in the recognition of intangible assets as required under the acquisition method of accounting which consist primarily of trademarks, customer contracts/relationships, covenants not to compete, technology, provider networks and value of business acquired. Definite-lived intangible assets are amortized over their estimated useful lives and are tested for impairment when events indicate that the carrying value may not be recoverable. The amortization of intangible assets is reflected in the unaudited condensed consolidated statements of operations in operating expenses within each segment. Although intangible assets contribute to the Company’s revenue generation, the amortization of intangible assets does not directly relate to the underwriting of the Company’s insurance products, the services performed for the Company’s customers or the sale of the Company’s products or services. Additionally, intangible asset amortization expense typically fluctuates based on the size and timing of the Company’s acquisition activity. Accordingly, the Company believes excluding the amortization of intangible assets enhances the Company’s and investors’ ability to compare the Company’s past financial performance with its current performance and to analyze underlying business performance and trends. Intangible asset amortization excluded from the related non-GAAP financial measure represents the entire amount recorded within the Company’s GAAP financial statements, and the revenue generated by the associated intangible assets has not been excluded from the related non-GAAP financial measure. Intangible asset amortization is excluded from the related non-GAAP financial measure because the amortization, unlike the related revenue, is not affected by operations of any particular period unless an intangible asset becomes impaired or the estimated useful life of an intangible asset is revised.
- The Company’s net realized capital gains and losses arise from various types of transactions, primarily in the course of managing a portfolio of assets that support the payment of insurance liabilities. Net realized capital gains and losses are reflected in the unaudited condensed consolidated statements of operations in net investment income (loss) within each segment. These capital gains and losses are the result of investment decisions, market conditions and other economic developments that are unrelated to the performance of the Company’s business, and the amount and timing of these capital gains and losses do not directly relate to the underwriting of the Company’s insurance products, the services performed for the Company’s customers or the sale of the Company’s products or services. Accordingly, the Company believes excluding net realized capital gains and losses enhances the Company’s and investors’ ability to compare the Company’s past financial performance with its current performance and to analyze underlying business performance and trends.
- During the three months ended March 31, 2023, the loss on assets held for sale relates to the Company’s long- term care (“LTC”) reporting unit within the Pharmacy & Consumer Wellness segment. During 2022, the Company determined that its LTC business was no longer a strategic asset and committed to a plan to sell it, at which time the LTC business met the criteria for held-for-sale accounting and its net assets were accounted for as assets held for sale. As of March 31, 2023, the net assets of the LTC business continued to meet the criteria for held-for-sale accounting and during the first quarter of 2023, a loss on assets held for sale was recorded to write down the carrying value of the LTC business to the Company’s best estimate of the ultimate selling price which reflects its estimated fair value less costs to sell. During the three months ended March 31, 2022, the loss on assets held for sale relates to the Company’s international health care business domiciled in Thailand (“Thailand business”), which was included in the Commercial Business reporting unit in the Health Care Benefits segment. The sale of the Thailand business closed in the second quarter of 2022, and the ultimate loss on the sale was not material.
- During the three months ended March 31, 2023, the acquisition-related transaction and integration costs relate to the acquisitions of Signify Health and Oak Street Health. The acquisition-related transaction and integration costs are reflected in the Company’s unaudited condensed consolidated statement of operations in operating expenses within the Corporate/Other segment
- During the three months ended March 31, 2023, the office real estate optimization charges primarily relate to the abandonment of leased real estate and the related right-of-use assets and property and equipment in connection with the planned reduction of corporate office real estate space in response to the Company’s new flexible work arrangement. The office real estate optimization charges are reflected in the Company’s unaudited condensed consolidated statement of operations in operating expenses within the Health Care Benefits, Corporate/Other and Health Services segments.
- During the three months ended March 31, 2022, the opioid litigation charge relates to an agreement to resolve substantially all opioid claims against the Company by the State of Florida. The opioid litigation charge is reflected within the Corporate/Other segment.
- The corresponding tax benefit or expense related to the items excluded from adjusted income attributable to CVS Health and Adjusted EPS above. The nature of each non-GAAP adjustment is evaluated to determine whether a discrete adjustment should be made to the adjusted income tax provision. During the three months ended March 31, 2022, the Company’s adjusted income tax provision also excludes the impact of certain discrete tax items concluded in the first quarter of 2022.
See endnotes (1), (2) and (3) on page 23 for definitions of non-GAAP financial measures. Reconciliations of each non-GAAP financial measure to the most directly comparable GAAP financial measure are presented on pages 13 through 14 and page 22.
Reconciliations of Non-GAAP Financial Measures to the Most Directly Comparable GAAP Financial Measures
Adjusted Operating Income (Unaudited)
The following are reconciliations of consolidated operating income (GAAP measure) to consolidated adjusted operating income, as well as reconciliations of segment GAAP operating income to segment adjusted operating income:
Adjusted Earnings Per Share (Unaudited)
The following are reconciliations of net income attributable to CVS Health to adjusted income attributable to CVS Health and calculations of GAAP diluted EPS and Adjusted EPS:
Supplemental Information (Unaudited)
The Company’s segments maintain separate financial information, and the Company’s chief operating decision maker (the “CODM”) evaluates the segments’ operating results on a regular basis in deciding how to allocate resources among the segments and in assessing segment performance. The CODM evaluates the performance of the Company’s segments based on adjusted operating income. Adjusted operating income is defined as operating income (GAAP measure) excluding the impact of amortization of intangible assets and other items, if any, that neither relate to the ordinary course of the Company’s business nor reflect the Company’s underlying business performance as further described in endnote (1). Effective for the first quarter of 2023, adjusted operating income also excludes the impact of net realized capital gains or losses. The Company uses adjusted operating income as its principal measure of segment performance as it enhances the Company’s ability to compare past financial performance with current performance and analyze underlying business performance and trends.
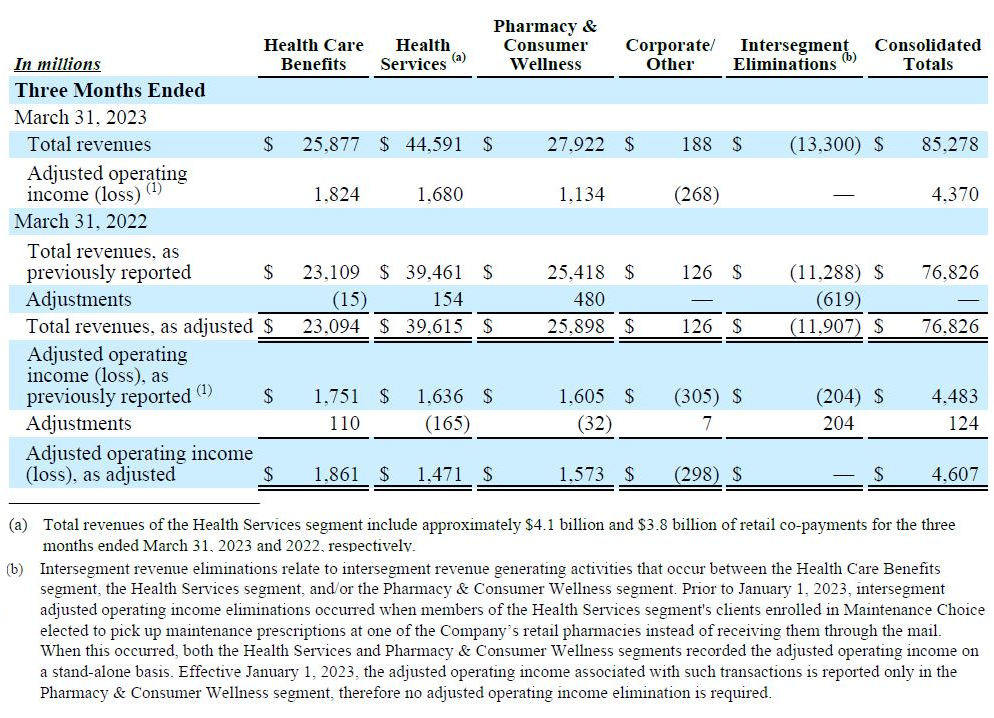
Segment financial information for the three months ended March 31, 2023 reflects the following items:
- The realignment of the Company’s segments to correspond with changes made to its operating model as described on page 2, including the discontinuance of the former Maintenance Choice segment reporting practice as described in Note (b) of the table below.
- The impact of the adoption of a new accounting standard related to the accounting for long-duration insurance contracts, which the Company adopted on January 1, 2023 using a modified retrospective transition method. Refer to Note 1 ‘‘Significant Accounting Policies’’ in the Company’s Quarterly Report on Form 10-Q for the period ended March 31, 2023 for further information regarding the adoption of this accounting standard.
- The exclusion of the impact of net realized capital gains or losses from adjusted operating income, as described on page 11.
Segment financial information for the three months ended March 31, 2022 has been revised to conform with current period presentation for these items, the impact of which are reflected in the “Adjustments” lines of the table below.
The following is a reconciliation of financial measures of the Company’s segments to the consolidated totals:
Supplemental Information (Unaudited)
Health Care Benefits segment (Unaudited)
The following table summarizes the Health Care Benefits segment’s performance for the respective periods:
Supplemental Information (Unaudited)
The following table shows the components of the change in health care costs payable during the three months ended March 31, 2023 and 2022:
The following table summarizes the Health Care Benefits segment’s days claims payable for the respective periods:

Supplemental Information (Unaudited)
Health Services Segment (formerly Pharmacy Services Segment)
The following table summarizes the Health Services segment’s performance for the respective periods:
Supplemental Information (Unaudited)
Pharmacy & Consumer Wellness Segment (formerly Retail/LTC Segment)
The following table summarizes the Pharmacy & Consumer Wellness segment’s performance for the respective periods:
Supplemental Information (Unaudited)
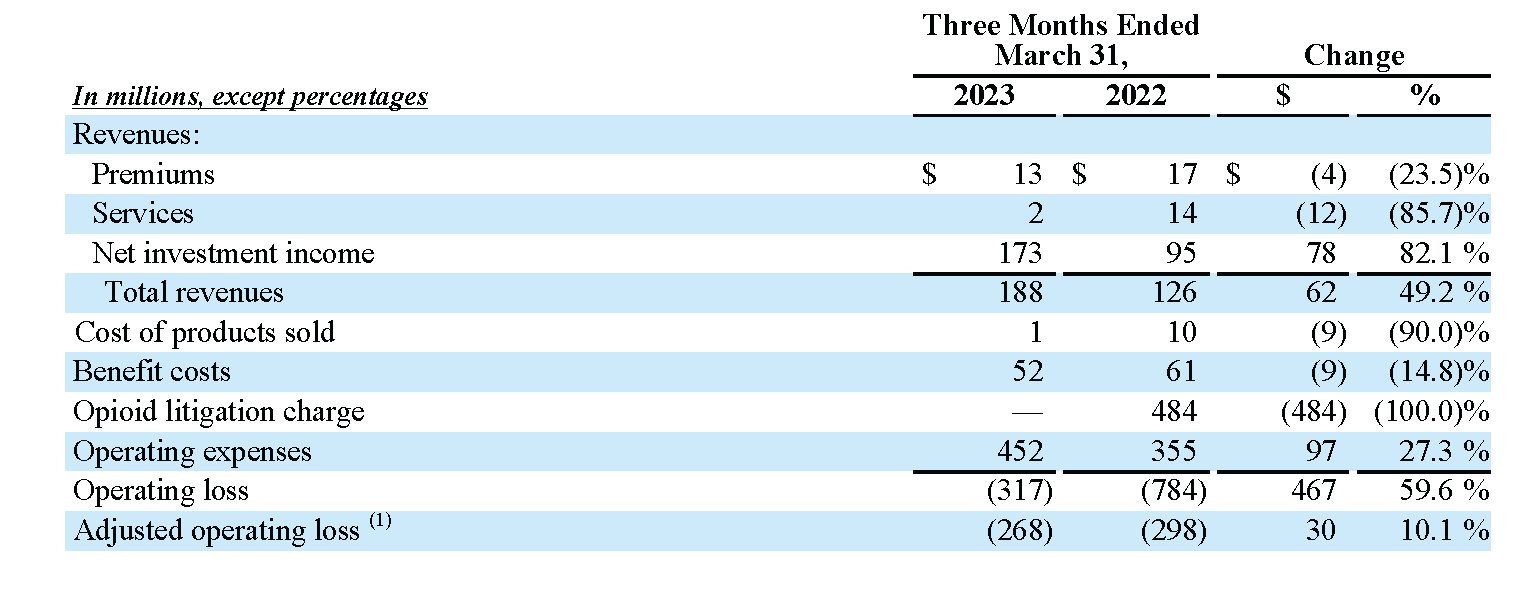
Corporate/Other Segment
The following table summarizes the Corporate/Other segment’s performance for the respective periods:
Adjusted Earnings Per Share Guidance (Unaudited)
The following reconciliations of projected net income attributable to CVS Health to projected adjusted income attributable to CVS Health and calculations of projected GAAP diluted EPS and projected Adjusted EPS contain forward-looking information. All forward-looking information involves risks and uncertainties. Actual results may differ materially from those contemplated by the forward-looking information for a number of reasons as described in our SEC filings, including those set forth in the Risk Factors section and under the heading “Cautionary Statement Concerning Forward-Looking Statements” in our most recently filed Annual Report on Form 10-K and our Quarterly Report on Form 10-Q for the quarterly period ended March 31, 2023. See “Non-GAAP Financial Information” earlier in this press release and endnote (2) later in this press release for more information on how we calculate Adjusted EPS.
Endnotes
(1) The Company defines adjusted operating income as operating income (GAAP measure) excluding the impact of amortization of intangible assets, net realized capital gains or losses and other items, if any, that neither relate to the ordinary course of the Company’s business nor reflect the Company’s underlying business performance, such as losses on assets held for sale, acquisition-related transaction and integration costs, office real estate optimization charges and opioid litigation charges. The Company uses adjusted operating income as its principal measure of segment performance as it enhances the Company’s ability to compare past financial performance with current performance and analyze underlying business performance and trends. The consolidated measure is not determined in accordance with GAAP and should not be considered a substitute for, or superior to, the most directly comparable GAAP measure, consolidated operating income. See “Non-GAAP Financial Information” earlier in this press release for additional information regarding the items excluded from consolidated operating income in determining consolidated adjusted operating income.
(2) Adjusted EPS is calculated by dividing adjusted income attributable to CVS Health by the Company’s weighted average diluted shares outstanding. The Company defines adjusted income attributable to CVS Health as net income attributable to CVS Health (GAAP measure) excluding the impact of amortization of intangible assets, net realized capital gains or losses and other items, if any, that neither relate to the ordinary course of the Company’s business nor reflect the Company’s underlying business performance, such as losses on assets held for sale, acquisition-related transaction and integration costs, office real estate optimization charges, opioid litigation charges, as well as the corresponding income tax benefit or expense related to the items excluded from adjusted income attributable to CVS Health and certain discrete tax items. See “Non-GAAP Financial Information” earlier in this press release for additional information regarding the items excluded from net income attributable to CVS Health in determining adjusted income attributable to CVS Health.
(3) The Company defines the adjusted effective income tax rate as the effective income tax rate (GAAP measure) excluding the corresponding tax benefit or expense related to the items excluded from adjusted income attributable to CVS Health above. The nature of each non-GAAP adjustment is evaluated to determine whether a discrete adjustment should be made to the adjusted effective income tax rate. During the three months ended March 31, 2022, the Company’s adjusted effective income tax rate also excludes the impact of certain discrete tax items concluded in the first quarter of 2022.
(4) Medical benefit ratio is calculated as benefit costs divided by premium revenues and represents the percentage of premium revenues spent on medical benefits for the Company’s insured members. Management uses MBR to assess the underlying business performance and underwriting of its insurance products, understand variances between actual results and expected results and identify trends in period-over-period results. MBR provides management and investors with information useful in assessing the operating results of the Company’s insured Health Care Benefits products.
(5) Medical membership represents the number of members covered by the Company’s insured and ASC medical products and related services at a specified point in time. Management uses this metric to understand variances between actual medical membership and expected amounts as well as trends in period-over-period results. This metric provides management and investors with information useful in understanding the impact of medical membership on segment total revenues and operating results.
(6) Pharmacy claims processed represents the number of prescription claims processed through the Company’s pharmacy benefits manager and dispensed by either its retail network pharmacies or the Company’s mail and specialty pharmacies. Prescriptions filled represents the number of prescriptions dispensed through the Pharmacy & Consumer Wellness segment’s retail and long-term care pharmacies and infusion services operations. Management uses these metrics to understand variances between actual claims processed and prescriptions dispensed, respectively, and expected amounts as well as trends in period-over-period results. These metrics provide management and investors with information useful in understanding the impact of pharmacy claim volume and prescription volume, respectively, on segment total revenues and operating results.
(7) Includes an adjustment to convert 90-day prescriptions to the equivalent of three 30-day prescriptions. This adjustment reflects the fact that these prescriptions include approximately three times the amount of product days supplied compared to a normal prescription.
(8) Health Services pharmacy network revenues relate to claims filled at retail and specialty retail pharmacies, including the Company’s retail pharmacies and LTC pharmacies. Effective January 1, 2023, pharmacy network revenues also include activity associated with Maintenance Choice, which permits eligible client plan members to fill their maintenance prescriptions through mail order delivery or at a CVS pharmacy retail store for the same price as mail order. Maintenance Choice activity was previously reflected in mail & specialty revenues. Prior period financial information has been revised to conform with current period presentation.
(9) Health Services mail & specialty revenues relate to specialty mail claims inclusive of Specialty Connect® claims picked up at a retail pharmacy, as well as mail order and specialty claims fulfilled by the Pharmacy & Consumer Wellness segment. Effective January 1, 2023, mail & specialty revenues exclude Maintenance Choice activity, which is now reflected within pharmacy network revenues. Prior period financial information has been revised to conform with current period presentation.
(10) Days claims payable is calculated by dividing the health care costs payable at the end of each quarter by the average health care costs per day during such quarter. Management and investors use this metric as an indicator of the adequacy of the Company’s health care costs payable liability at the end of each quarter and as an indicator of changes in such adequacy over time.
(11) Gross profit is calculated as the segment’s total revenues less its cost of products sold. Gross margin is calculated by dividing the segment’s gross profit by its total revenues and represents the percentage of total revenues that remains after incurring direct costs associated with the segment’s products sold and services provided. Gross margin provides investors with information that may be useful in assessing the operating results of the Company’s Health Services and Pharmacy & Consumer Wellness segments.
(12) Generic dispensing rate is calculated by dividing the segment’s generic drug claims processed or prescriptions filled by its total claims processed or prescriptions filled. Management uses this metric to evaluate the effectiveness of the business at encouraging the use of generic drugs when they are available and clinically appropriate, which aids in decreasing costs for client members and retail customers. This metric provides management and investors with information useful in understanding trends in segment total revenues and operating results.
(13) Same store sales and prescription volume represent the change in revenues and prescriptions filled in the Company’s retail pharmacy stores that have been operating for greater than one year, expressed as a percentage that indicates the increase or decrease relative to the comparable prior period. Same store metrics exclude revenues and prescriptions from LTC and infusion services operations. Effective January 1, 2023, same store sales also include digital sales initiated online or through mobile applications and fulfilled through the Company’s distribution centers. Prior period financial information has been revised to conform with current period presentation. Management uses these metrics to evaluate the performance of existing stores on a comparable basis and to inform future decisions regarding existing stores and new locations. Same-store metrics provide management and investors with information useful in understanding the portion of current revenues and prescriptions resulting from organic growth in existing locations versus the portion resulting from opening new stores.