CVS Health reports strong fourth quarter and full-year 2022 results
View print-friendly version (PDF)
Visit Investor Relations for more about Q4 2022 earnings
WOONSOCKET, RHODE ISLAND, February 8, 2023 - CVS Health Corporation (NYSE: CVS) today announced operating results for the three months and year ended December 31, 2022.
Key financial data
Fourth quarter highlights
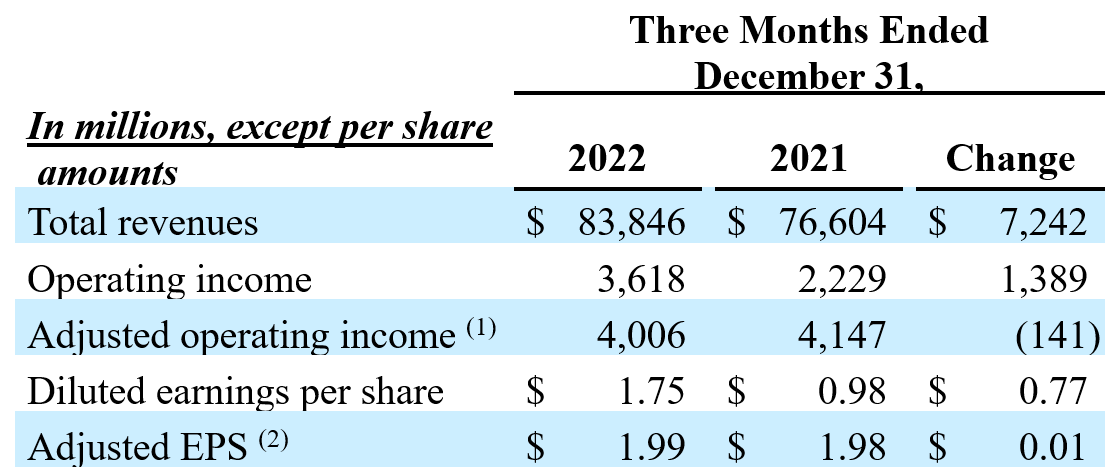
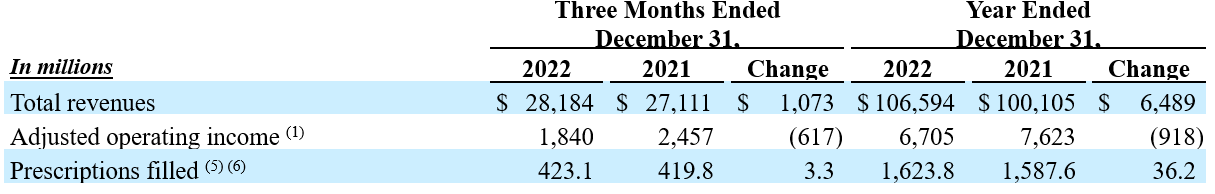
- Total revenues increased to $83.8 billion, up 9.5% compared to prior year
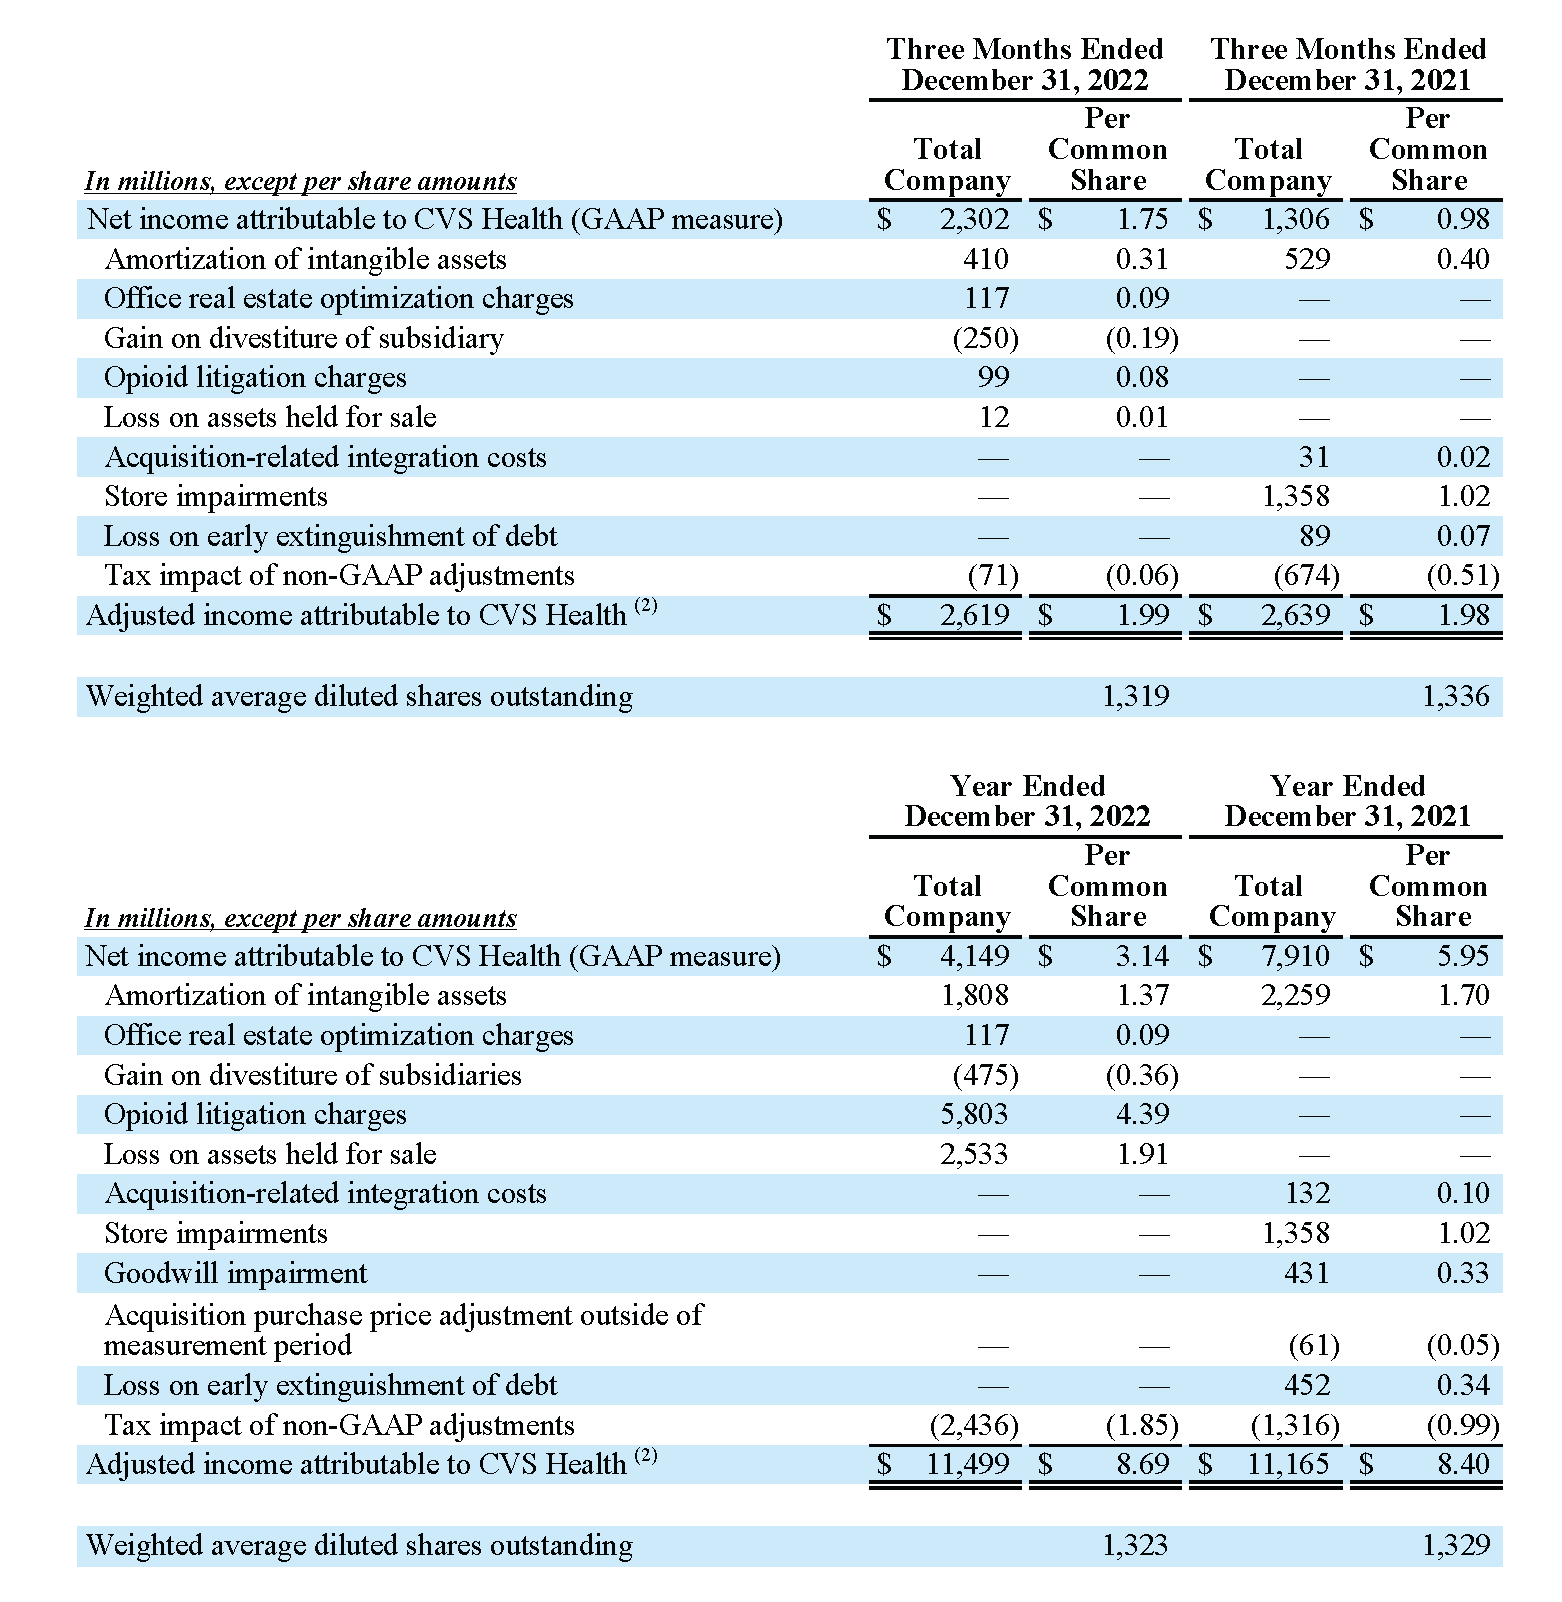
- GAAP diluted EPS of $1.75 and Adjusted EPS of $1.99
Full year highlights
- Total revenues increased to $322.5 billion, up 10.4% compared to prior year
- GAAP diluted EPS of $3.14 and Adjusted EPS of $8.69
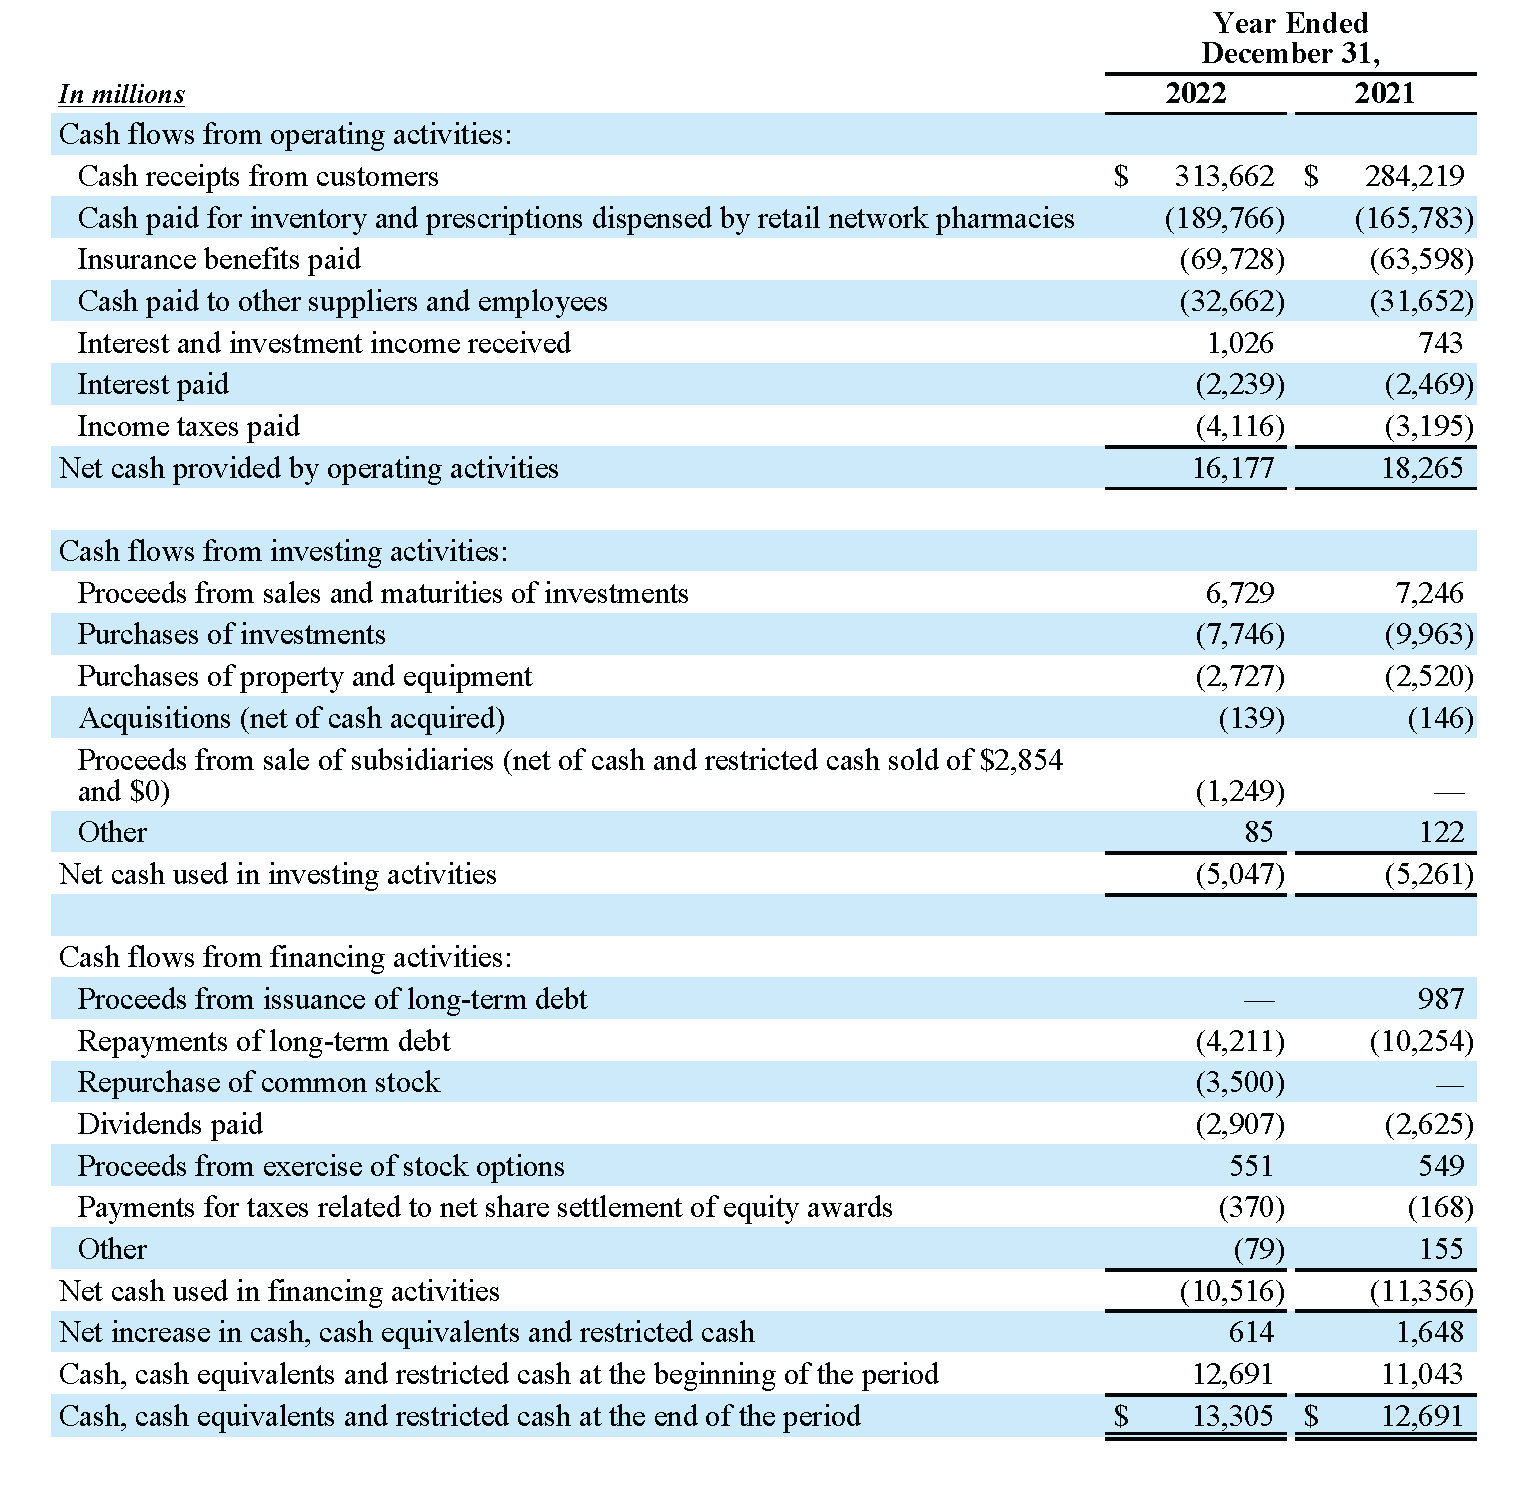
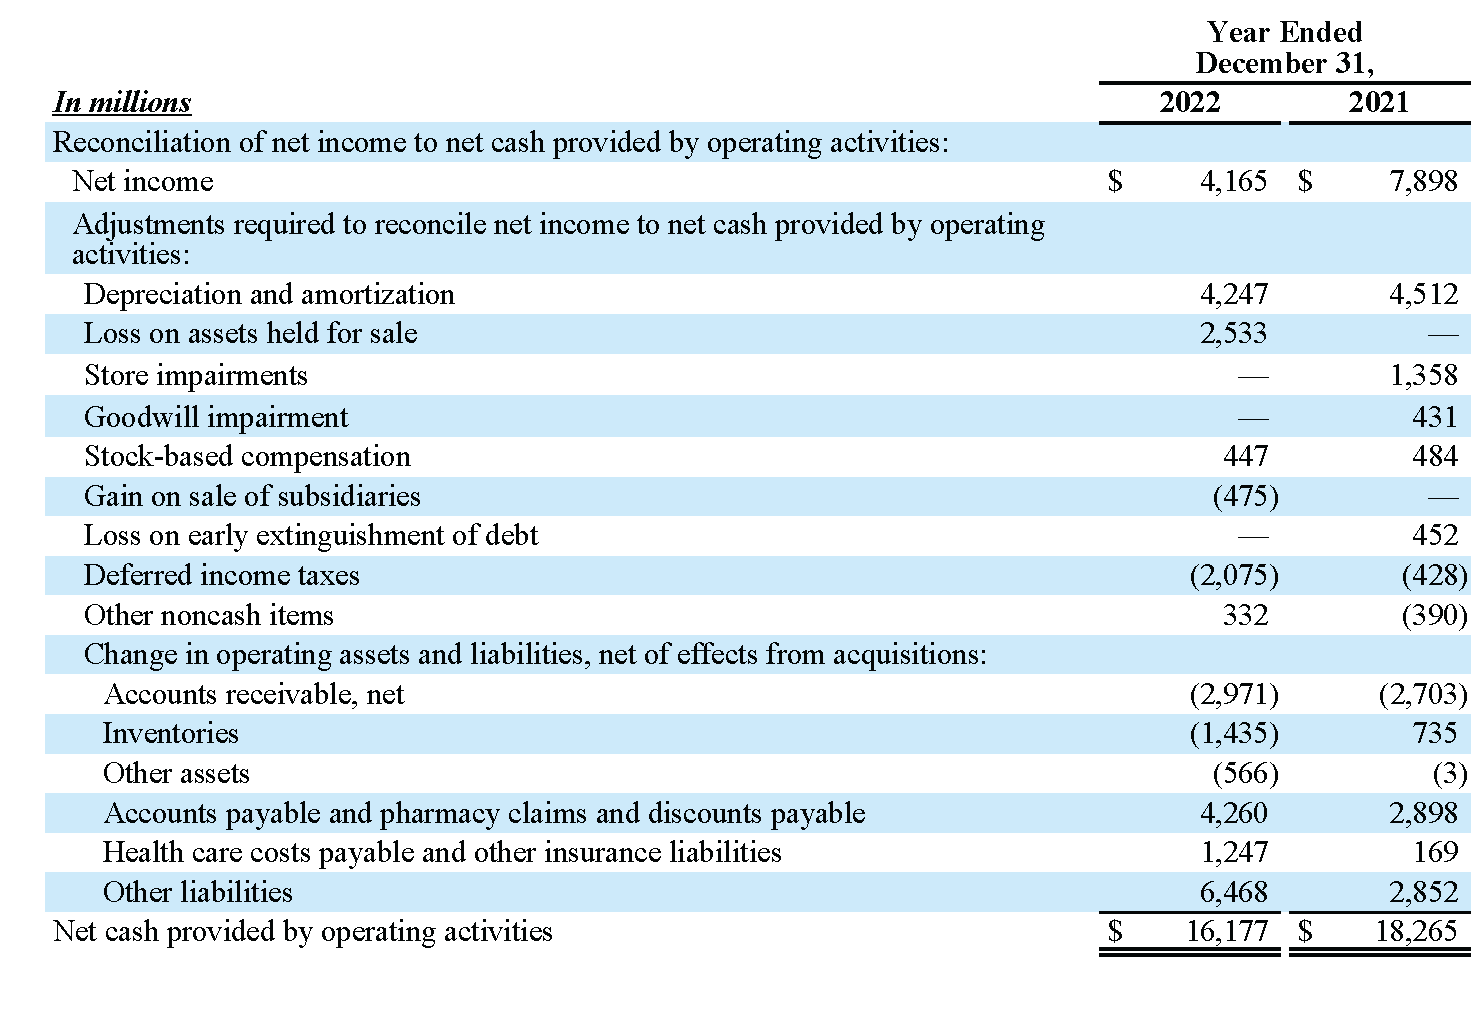
- Generated cash flow from operations of $16.2 billion
- Repaid $4.1 billion of long-term debt
2023 Full-year guidance
- GAAP diluted EPS guidance range of $7.73 to $7.93
- Adjusted EPS guidance range of $8.70 to $8.90
- Cash flow from operations guidance range of $12.5 billion to $13.5 billion
CEO commentary
“Last year was defined by outperformance across our foundational businesses, robust cash flow from operations and meaningful progress against our value-based care delivery strategy. 2022 was a year of progress, and we continue to build on that momentum with bold moves that will improve the health care experience.”
— Karen S. Lynch, CVS Health President and CEO
2022 in the spotlight
Entered into a definitive agreement to acquire Signify Health, a leader in home Health Risk Assessments, value-based care and provider enablement with a network of more than 10,000 clinicians across all 50 states.
Announced a 10% increase to the quarterly shareholder dividend, which became effective with the February 1, 2023 dividend distribution. Returned $2.9 billion to shareholders through dividends, while repurchasing 34.1 million shares of common stock and authorizing a new $10.0 billion share repurchase program.
Increased unique digital customers by seven million to over 47 million, reached eight million active users on CVS Health’s individualized Health Dashboard and interacted with nearly five million customers daily across our community footprint.
Deepened our executive bench with several key appointments, including Dr. Amar Desai as President, Health Care Delivery and Tilak Mandadi as Executive Vice President and Chief Data, Digital and Technology Officer.
Contacts
Investor contact
Larry McGrath
Senior Vice President, Business Development and Investor Relations
800-201-0938
Media contact
T.J. Crawford
Vice President, External Affairs
212-457-0583
The Company presents both GAAP and non-GAAP financial measures in this press release to assist in the comparison of the Company’s past financial performance with its current financial performance. See “Non-GAAP Financial Information” beginning on page 13 and endnotes beginning on page 25 for explanations of non-GAAP financial measures presented in this press release. See pages 15 through 16 and page 24 for reconciliations of each non-GAAP financial measure used in this release to the most directly comparable GAAP financial measure.
Consolidated Fourth Quarter and Full-Year Results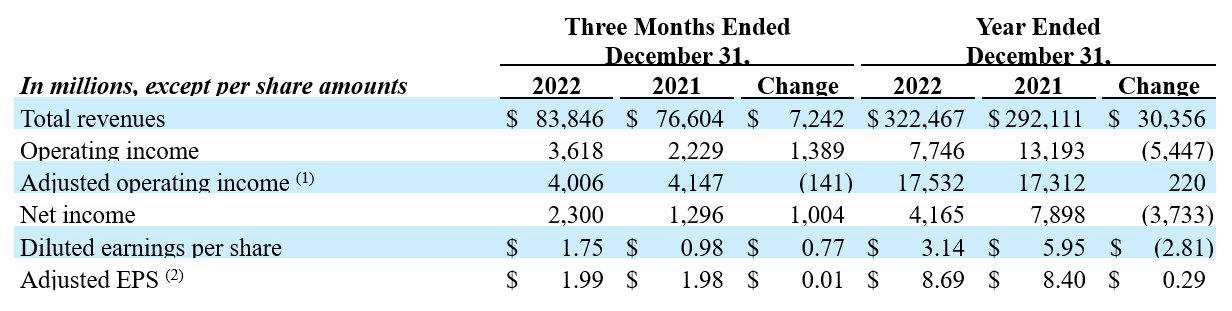
For the three months and year ended December 31, 2022 compared to the prior year:
- Total revenues increased 9.5% and 10.4%, respectively, driven by growth across all segments.
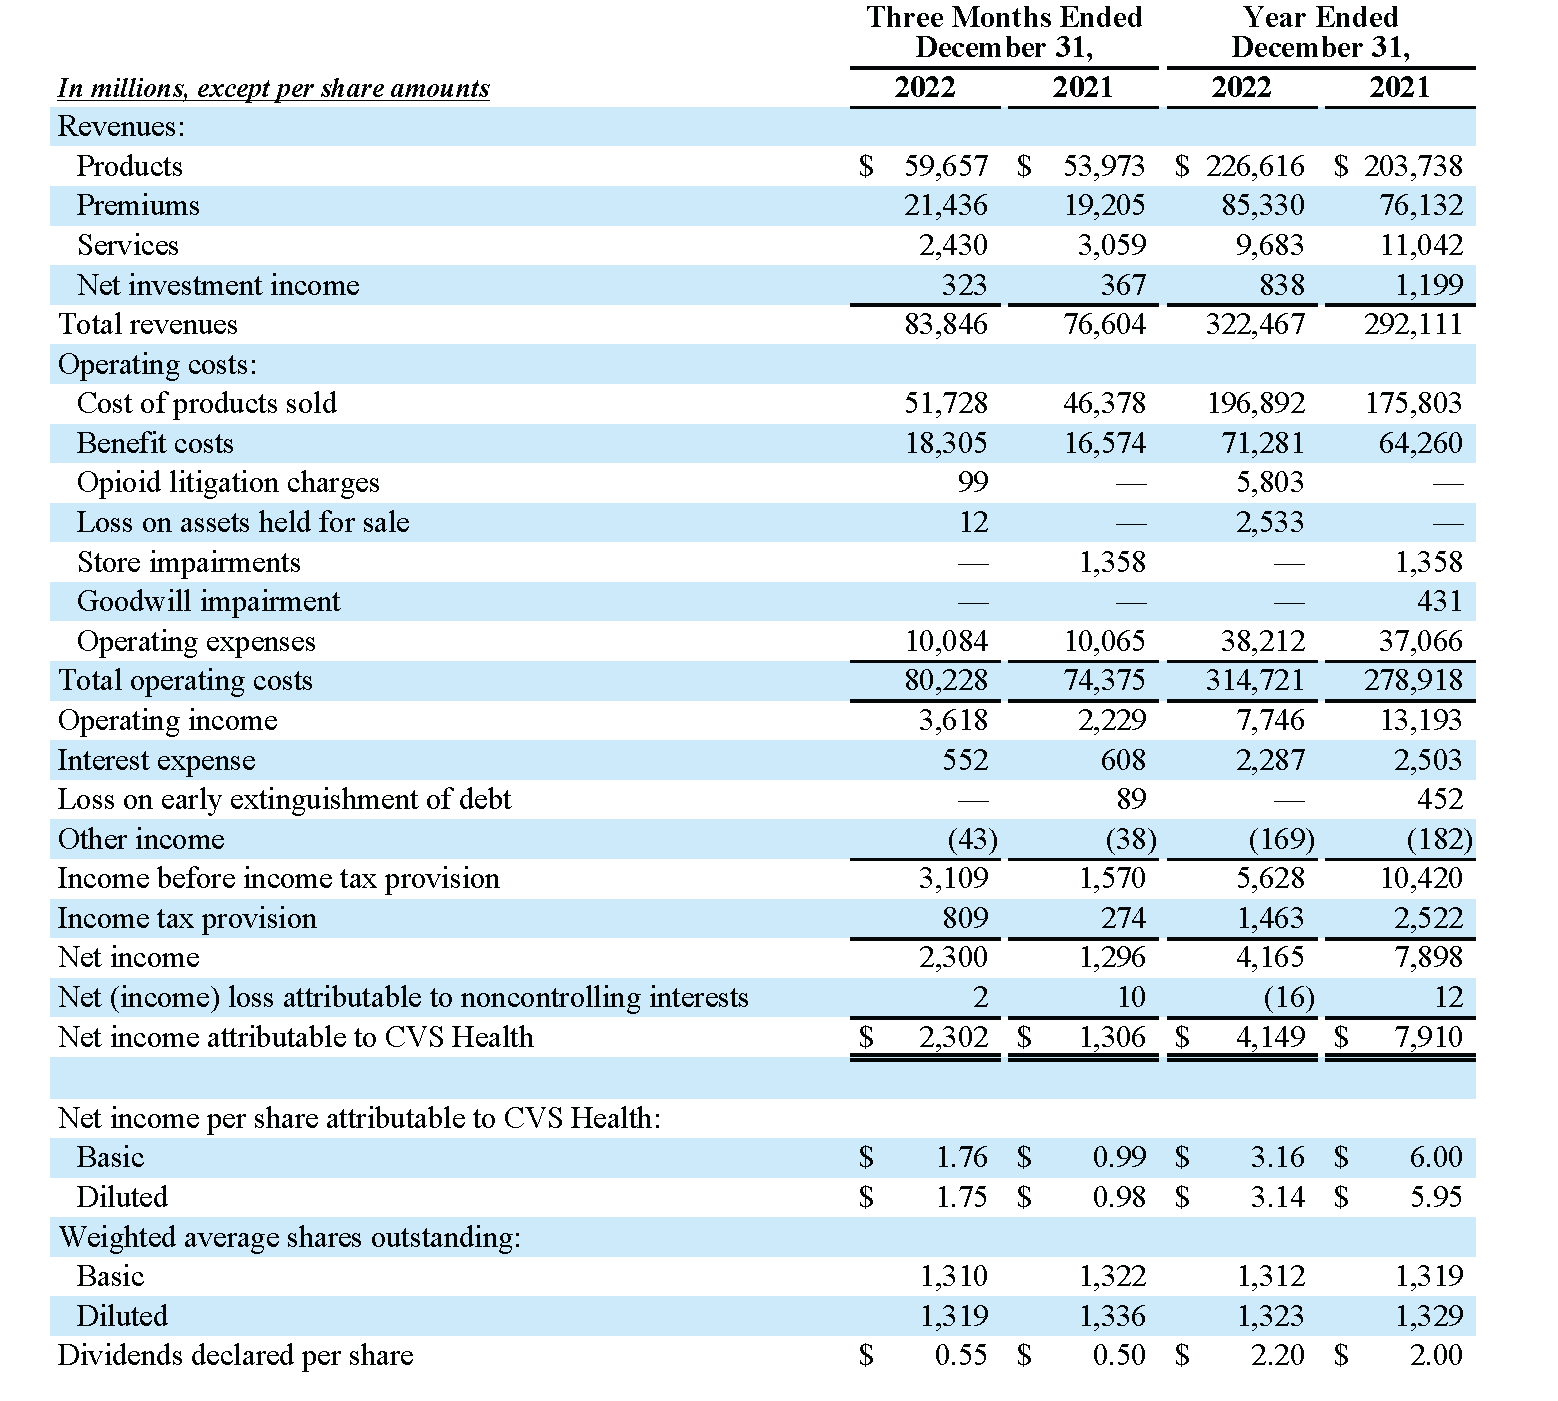
- Operating income increased 62.3% in the three months ended December 31, 2022 compared to the prior year primarily due to the absence of a store impairment charge of approximately $1.4 billion recorded in the prior year, as well as a pre-tax gain of $250 million on the sale of the Company’s wholly-owned subsidiary bswift LLC (“bswift”) recorded in the three months ended December 31, 2022. These increases were partially offset by the decreases in adjusted operating income described below.
- Operating income decreased 41.3% for the year ended December 31, 2022 compared to the prior year primarily due to $5.8 billion of opioid litigation charges and a $2.5 billion loss on assets held for sale related to the write-down of the Company’s Omnicare® long-term care business (“LTC business”), both of which were recorded during 2022. These decreases were partially offset by the absence of the store impairment charge of approximately $1.4 billion and a $431 million goodwill impairment charge on the remaining goodwill of the LTC reporting unit, both of which were recorded in the prior year, a decrease in amortization of intangible assets compared to the prior year, as well as pre-tax gains of $250 million on the sale of bswift and $225 million on the sale of PayFlex Holdings, Inc. (“PayFlex”) recorded in 2022.
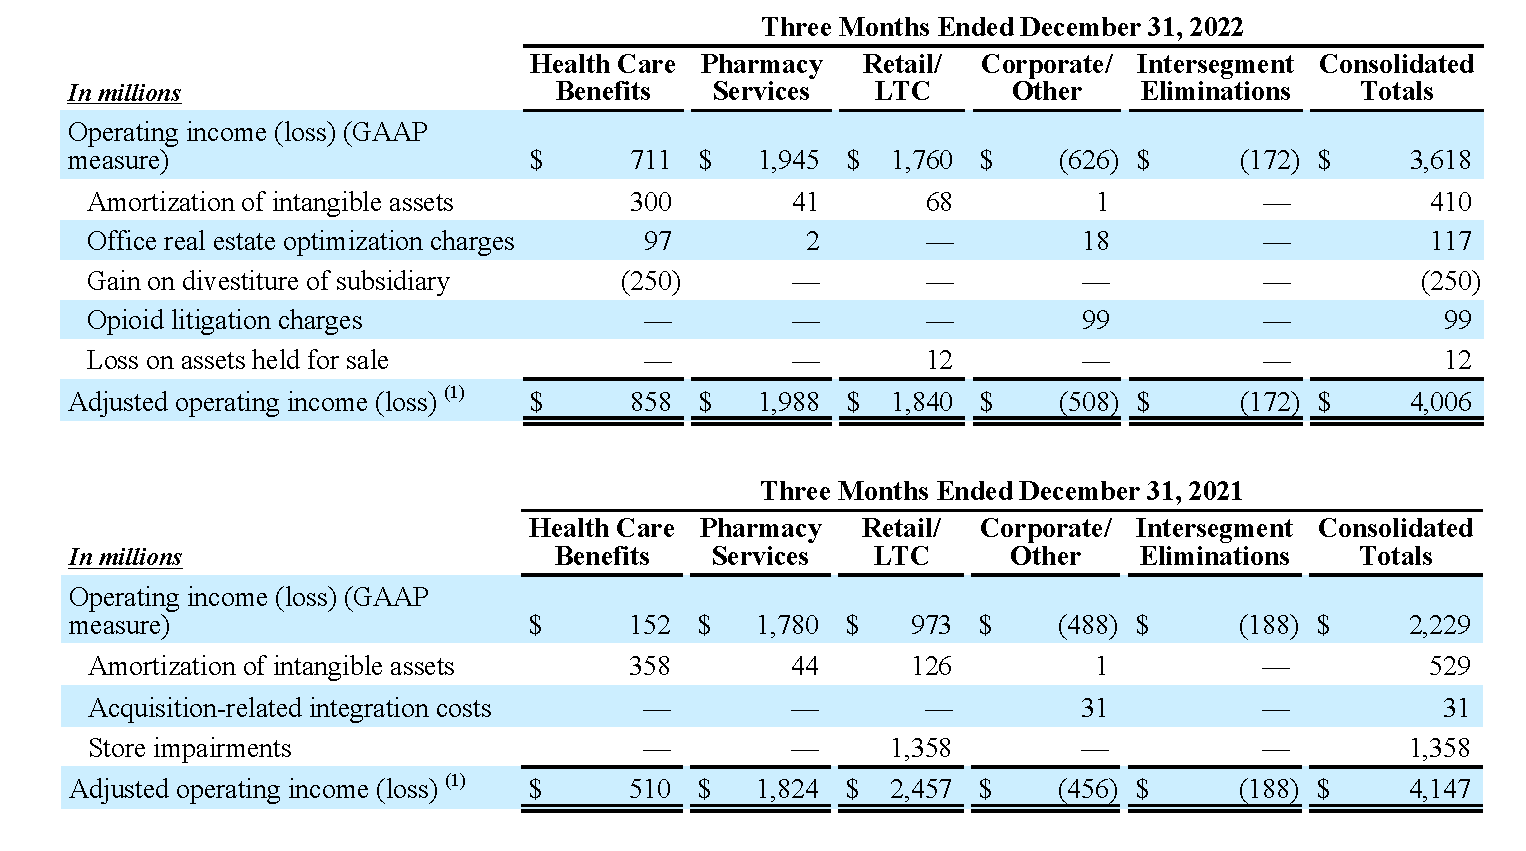
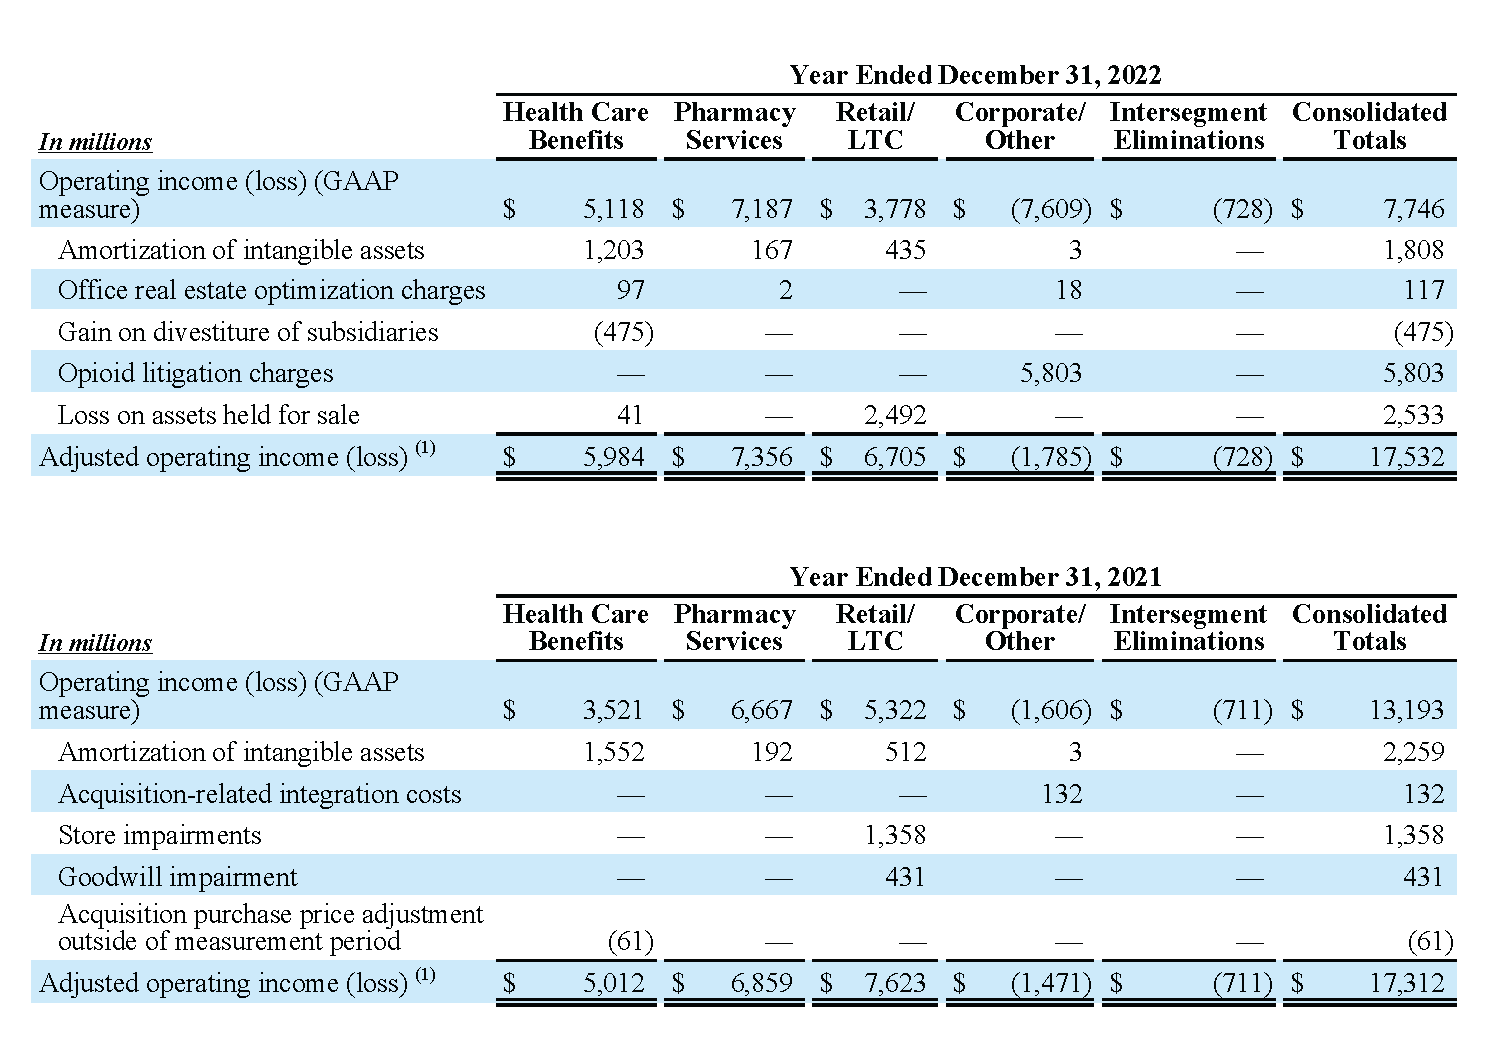
- Adjusted operating income decreased $141 million in the three months ended December 31, 2022 compared to the prior year primarily driven by declines in the Retail/LTC and Corporate/Other segments, largely offset by increases in the Health Care Benefits and Pharmacy Services segments. Adjusted operating income increased $220 million in the year ended December 31, 2022 compared to the prior year primarily driven by increases in the Health Care Benefits and Pharmacy Services segments, partially offset by declines in the Retail/LTC and Corporate/Other segments. See pages 3 through 5 and page 22 for additional discussion of adjusted operating income performance of the Company’s segments.
- Interest expense decreased $56 million, or 9.2%, and $216 million, or 8.6%, respectively, due to lower debt in the three months and year ended December 31, 2022.
- The effective income tax rate in the fourth quarter increased to 26.0% compared to 17.5% in the prior year primarily due to the absence of the favorable impact of a prior year refund claim. The effective income tax rate for the full year increased to 26.0% compared to 24.2% in the prior year primarily due to certain nondeductible legal charges and basis differences on the sale of certain subsidiaries in the year ended December 31, 2022. These increases were partially offset by the impact of certain discrete tax items concluded in the first quarter of 2022.
Health Care Benefits Segment
The Health Care Benefits segment offers a full range of insured and self-insured (“ASC”) medical, pharmacy, dental and behavioral health products and services. The segment results for the three months and years ended December 31, 2022 and 2021 were as follows: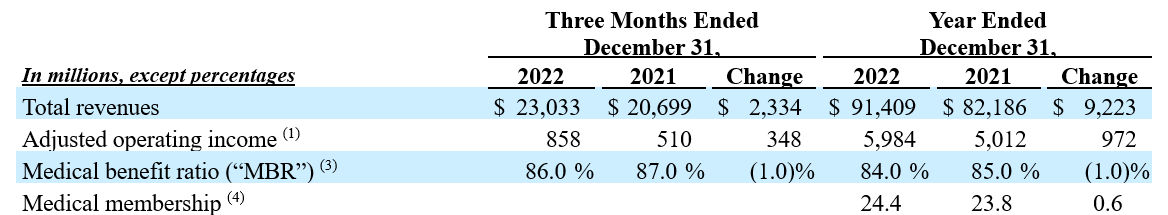
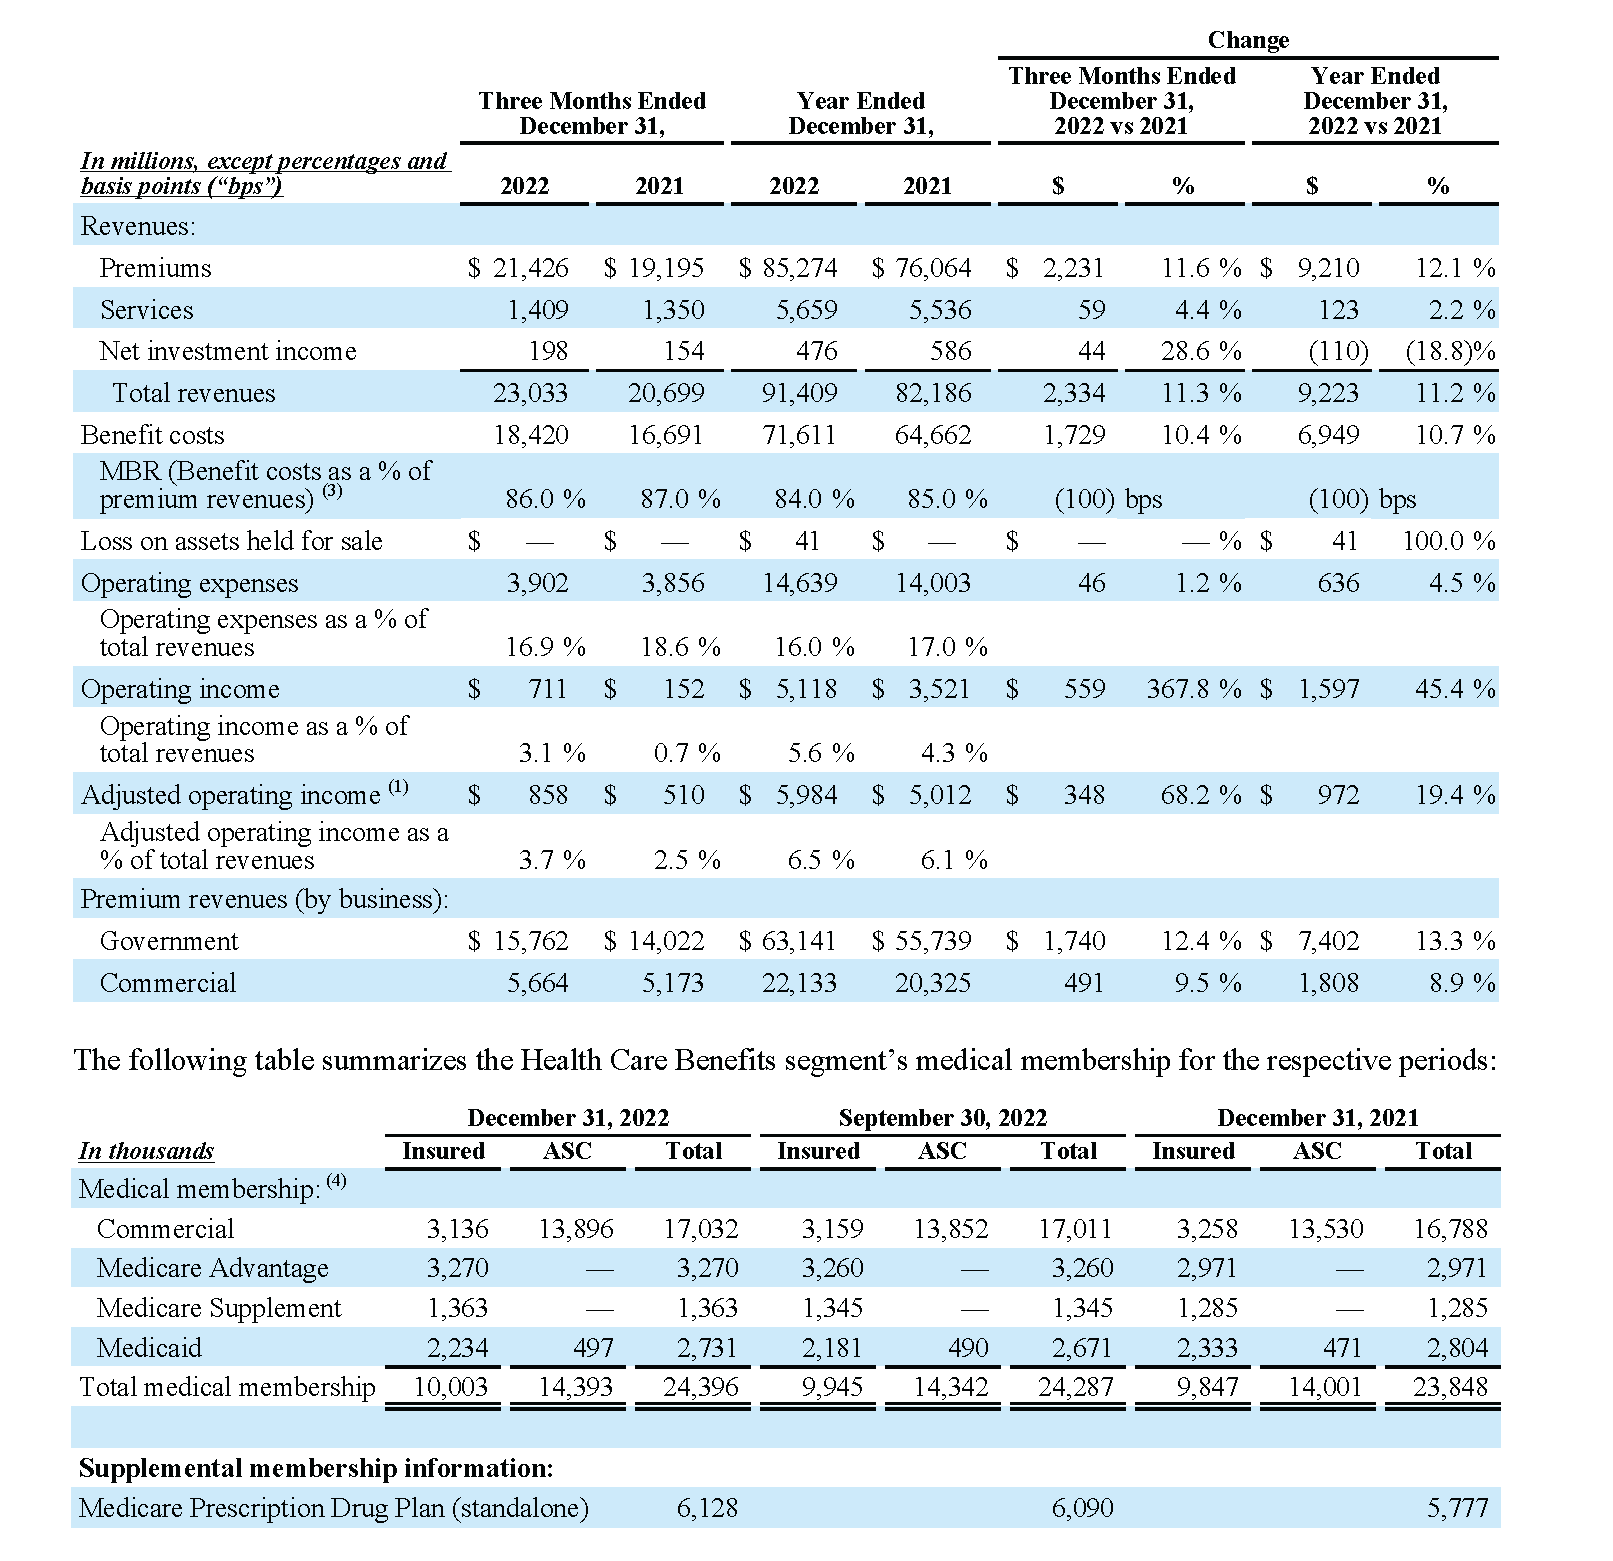
- Total revenues increased 11.3% and 11.2% for the three months and year ended December 31, 2022, respectively, compared to the prior year driven by growth across all product lines.
- Adjusted operating income increased 68.2% for the three months ended December 31, 2022 compared to the prior year primarily driven by the net favorable impact of COVID-19 compared to the prior year and strong underlying performance, partially offset by the unfavorable impact of the flu compared to the prior year.
- Adjusted operating income increased 19.4% for the year ended December 31, 2022 compared to the prior year primarily driven by the net favorable impact of COVID-19 compared to the prior year, strong underlying performance and membership growth. These increases were partially offset by incremental investments to support growth in the business, the unfavorable impact of the flu compared to the prior year and net realized capital losses.
- The MBR decreased from 87.0% to 86.0% in the three months ended December 31, 2022 compared to the prior year and decreased from 85.0% to 84.0% in the year ended December 31, 2022 compared to the prior year. The decrease in both periods was primarily driven by the net favorable impact of COVID-19 compared to the prior year, partially offset by the unfavorable impact of the flu compared to the prior year.
- Medical membership as of December 31, 2022 of 24.4 million increased 109,000 members compared with September 30, 2022, reflecting increases across all product lines.
- Medical membership as of December 31, 2022 of 24.4 million increased 548,000 members compared with December 31, 2021, reflecting increases in Medicare and Commercial membership, as underlying Commercial growth more than offset the impact of international divestitures. These increases were partially offset by a decline in Medicaid membership reflecting the previously disclosed loss of a large customer in the third quarter of 2022.
- The segment experienced favorable development of prior-periods’ health care cost estimates in its Government Services and Commercial businesses during the three months ended December 31, 2022, primarily attributable to third quarter 2022 performance.
- Prior years’ health care costs payable estimates developed favorably by $654 million during the year ended December 31, 2022. This development is reported on a basis consistent with the prior years’ development reported in the health care costs payable table in the Company’s annual audited financial statements and does not directly correspond to an increase in 2022 operating results.
See the supplemental information on page 19 for additional information regarding the performance of the Health Care Benefits segment.
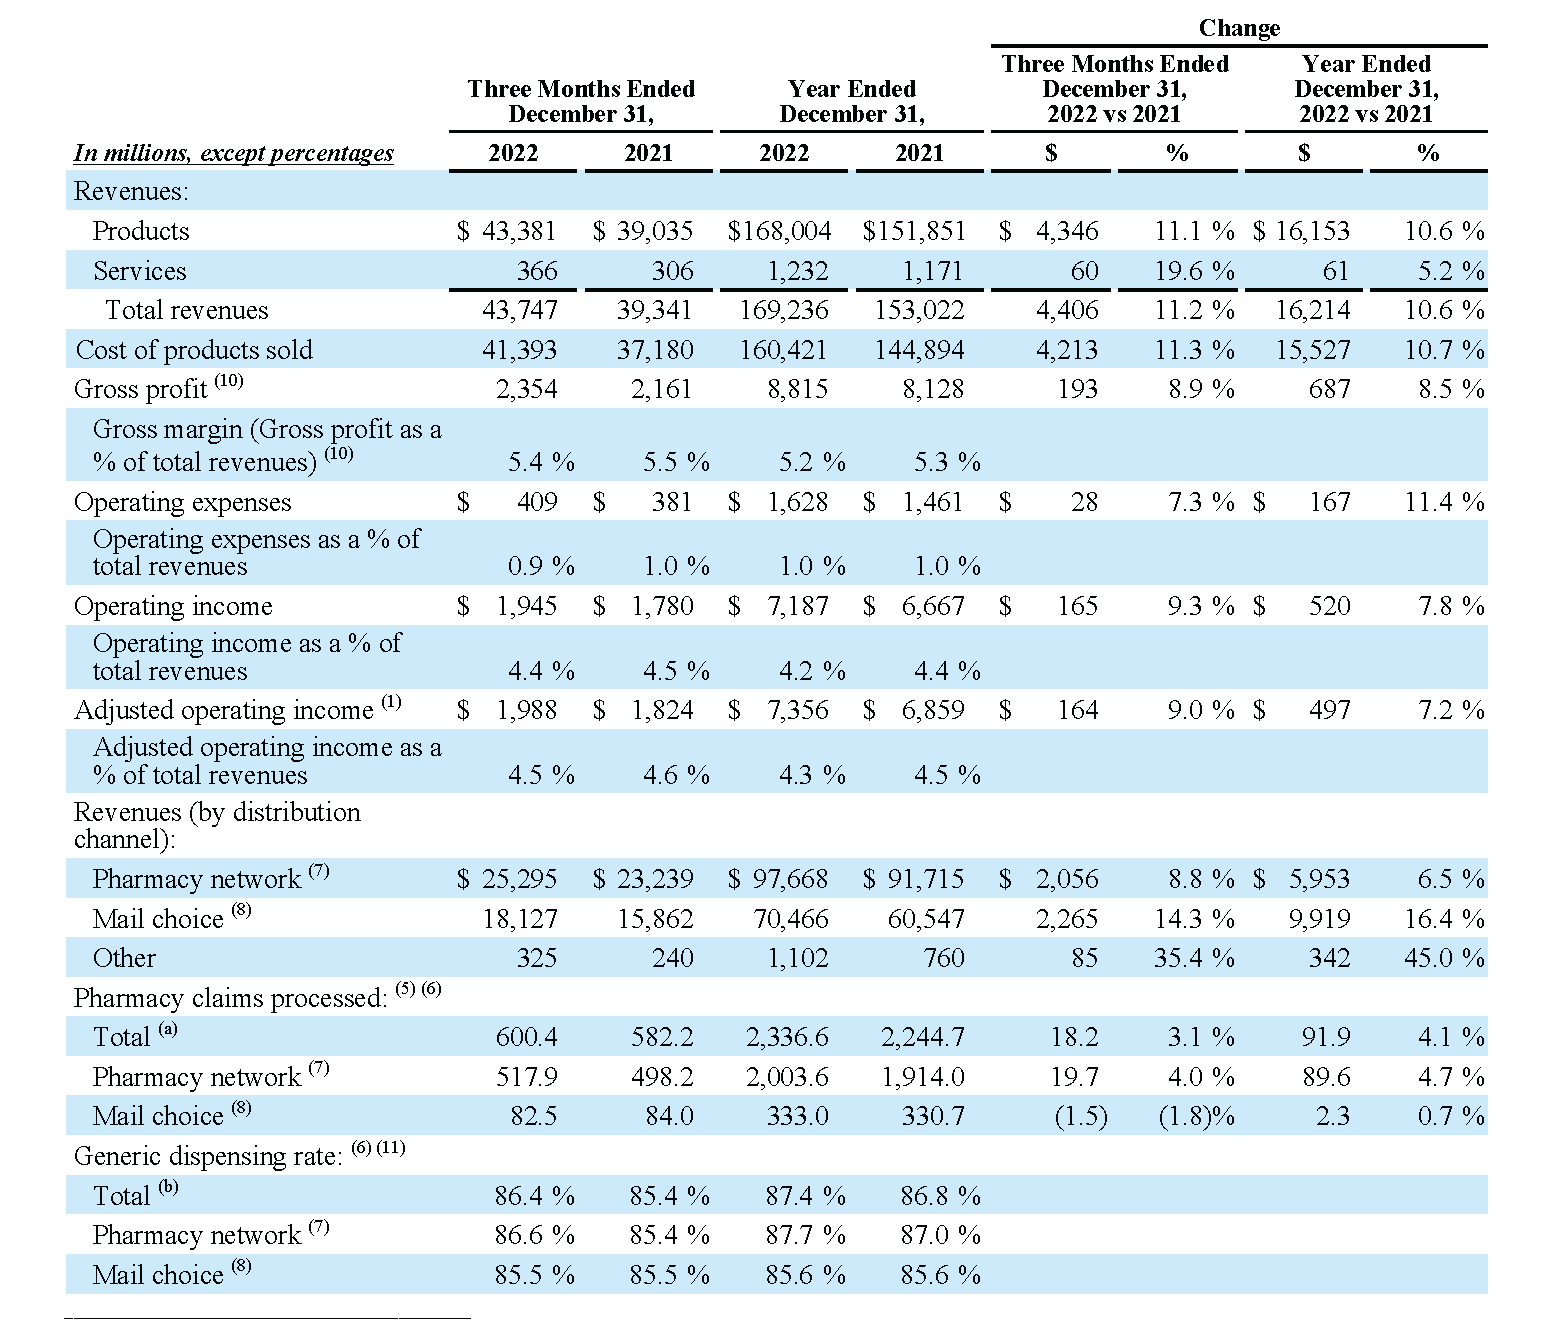
Pharmacy Services Segment
The Pharmacy Services segment provides a full range of pharmacy benefit management solutions to employers, health plans, government employee groups and government sponsored programs. The segment results for the three months and years ended December 31, 2022 and 2021 were as follows:
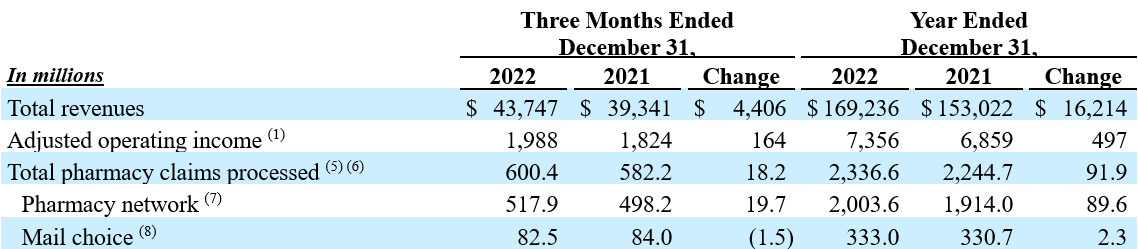
- Total revenues increased 11.2% and 10.6% for the three months and year ended December 31, 2022, respectively, compared to the prior year primarily driven by increased pharmacy claims volume, growth in specialty pharmacy and brand inflation, partially offset by continued client price improvements.
- Adjusted operating income increased 9.0% and 7.2% for the three months and year ended December 31, 2022, respectively, compared to the prior year primarily driven by improved purchasing economics, including increased contributions from the products and services of the Company’s group purchasing organization, partially offset by continued client price improvements.
- Total pharmacy claims processed increased 3.1% and 4.1% on a 30-day equivalent basis for the three months and year ended December 31, 2022, respectively, compared to the prior year primarily driven by net new business, increased utilization and the impact of an elevated cough, cold and flu season compared to the prior year. These increases were partially offset by a decrease in COVID-19 vaccinations. Excluding the impact of COVID-19 vaccinations, total pharmacy claims processed increased 4.6% and 5.1% on a 30-day equivalent basis for the three months and year ended December 31, 2022, respectively, compared to the prior year.
See the supplemental information on page 21 for additional information regarding the performance of the Pharmacy Services segment.
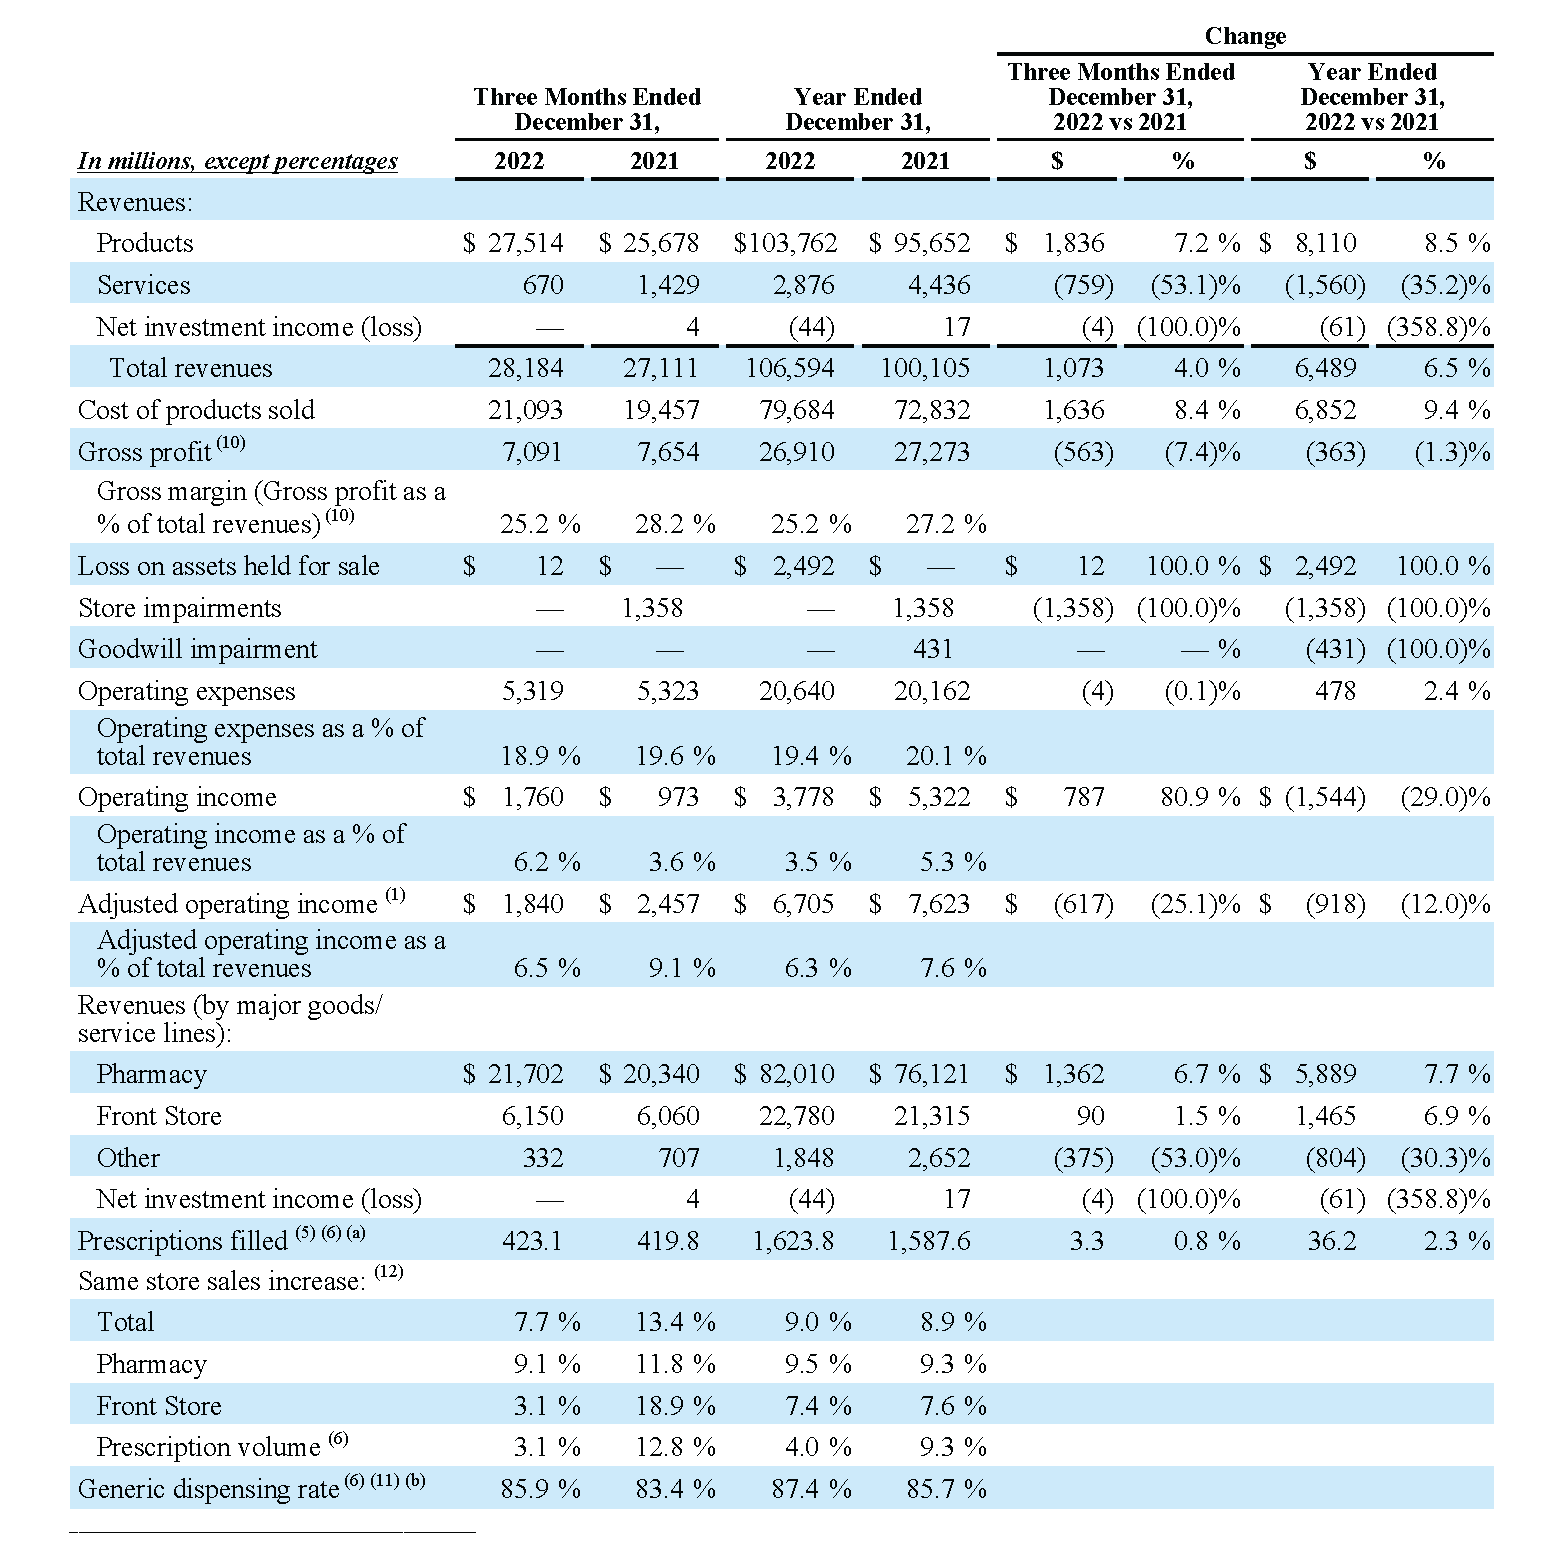
Retail/LTC Segment
The Retail/LTC segment fulfills prescriptions for medications, provides patient care programs, sells a wide assortment of health and wellness products and general merchandise, provides health care services through walk-in medical clinics, provides medical diagnostic testing, administers vaccinations and provides pharmacy services to long-term care facilities. The segment results for the three months and years ended December 31, 2022 and 2021 were as follows:
- Total revenues increased 4.0% and 6.5% for the three months and year ended December 31, 2022, respectively, compared to the prior year primarily driven by increased prescription and front store volume, including the impact of an elevated cough, cold and flu season compared to the prior year, pharmacy drug mix and brand inflation. These increases were partially offset by decreased COVID-19 vaccinations and diagnostic testing, the impact of recent generic introductions and continued pharmacy reimbursement pressure.
- Adjusted operating income decreased 25.1% and 12.0% for the three months and year ended December 31, 2022, respectively, compared to the prior year primarily driven by decreased COVID-19 vaccinations and diagnostic testing, continued pharmacy reimbursement pressure, increased investments in the segment’s operations and capabilities and decreased gains from legal settlements compared to the prior year. These decreases were partially offset by the increased prescription volume described above, improved generic drug purchasing and the favorable impact of business initiatives in the three months and year ended December 31, 2022. The decrease in adjusted operating income for the year ended December 31, 2022 was also partially offset by increased front store volume.
- Prescriptions filled increased 0.8% and 2.3% on a 30-day equivalent basis for the three months and year ended December 31, 2022, respectively, compared to the prior year primarily driven by increased utilization and the impact of an elevated cough, cold and flu season compared to the prior year, partially offset by a decrease in COVID-19 vaccinations. Excluding the impact of COVID-19 vaccinations, prescriptions filled increased 4.0% and 4.4% on a 30-day equivalent basis for the three months and year ended December 31, 2022, respectively, compared to the prior year.
See the supplemental information on page 22 for additional information regarding the performance of the Retail/LTC segment.
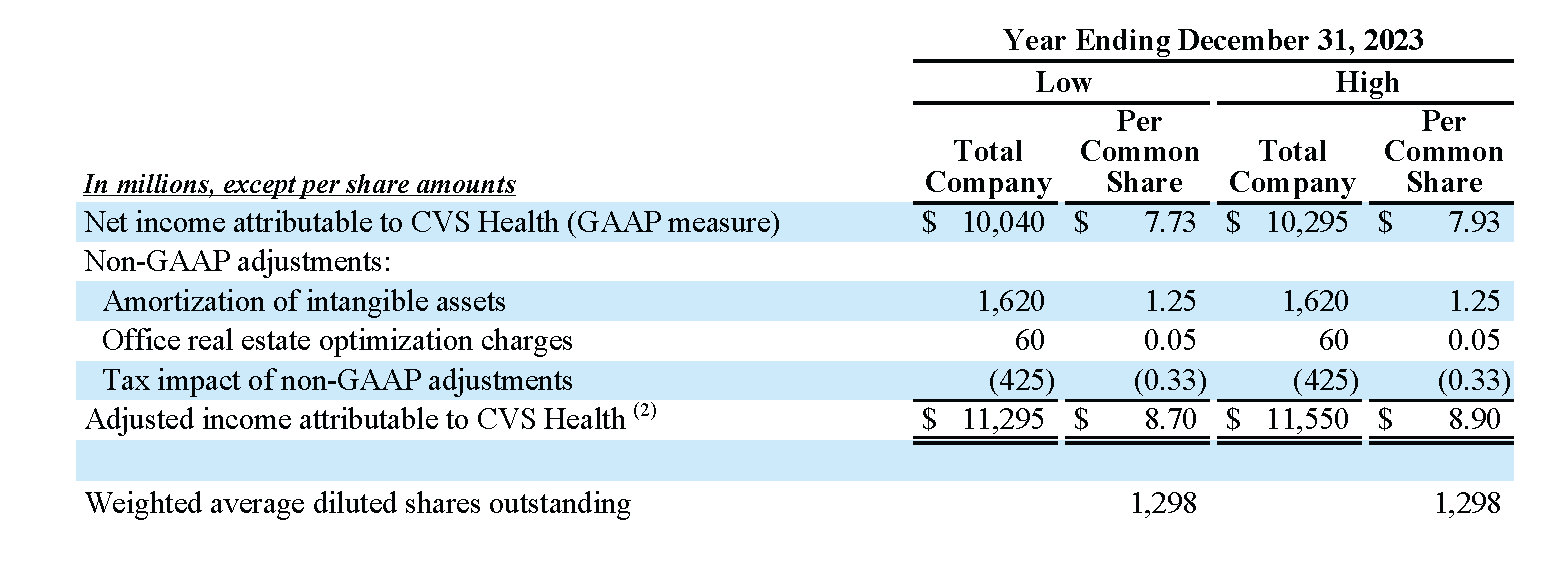
2023 Full-Year Guidance
The Company issued its full-year 2023 GAAP diluted EPS guidance range of $7.73 to $7.93 and reaffirmed its full-year 2023 Adjusted EPS guidance range of $8.70 to $8.90. The Company also issued its full-year 2023 cash flow from operations guidance range of $12.5 billion to $13.5 billion.
The adjustments between full-year 2023 GAAP diluted EPS and Adjusted EPS include amortization of intangible assets, office real estate optimization charges and the corresponding income tax benefit or expense related to the items excluded from adjusted income attributable to CVS Health.
The Company’s full-year 2023 guidance does not include any impact, including acquisition-related transaction and integration costs, related to the pending acquisition of Signify Health, Inc. (“Signify Health”).
Teleconference and Webcast
The Company will be holding a conference call today for investors at 8:00 a.m. (Eastern Time) to discuss its fourth quarter and full-year results. An audio webcast of the call will be broadcast simultaneously for all interested parties through the Investor Relations section of the CVS Health website at http://investors.cvshealth.com. This webcast will be archived and available on the website for a one-year period following the conference call.
About CVS Health
CVS Health is the leading health solutions company, delivering care like no one else can. We reach more people and improve the health of communities across America through our local presence, digital channels and over 300,000 dedicated colleagues – including more than 40,000 physicians, pharmacists, nurses, and nurse practitioners. Wherever and whenever people need us, we help them with their health – whether that’s managing chronic diseases, staying compliant with their medications, or accessing affordable health and wellness services in the most convenient ways. We help people navigate the health care system – and their personal health care – by improving access, lowering costs and being a trusted partner for every meaningful moment of health. And we do it all with heart, each and every day. Follow @CVSHealth on social media.
Cautionary Statement Concerning Forward-Looking Statements
The Private Securities Litigation Reform Act of 1995 provides a safe harbor for forward-looking statements made by or on behalf of CVS Health Corporation. Statements in this press release that are forward-looking include, but are not limited to, Ms. Lynch’s quotation, the information under the headings “2023 Full-Year Guidance” and “2022 In The Spotlight” and the information included in the reconciliations and endnotes. By their nature, all forward-looking statements are not guarantees of future performance or results and are subject to risks and uncertainties that are difficult to predict and/or quantify. Actual results may differ materially from those contemplated by the forward-looking statements due to the risks and uncertainties related to CVS Health’s proposed acquisition of Oak Street Health, Inc. and pending acquisition of Signify Health, Inc., and the COVID-19 pandemic, including the potential emergence of additional variants, vaccine and testing protocols, government testing initiatives, the geographies impacted by and the severity and duration of the pandemic, the pandemic’s impact on the U.S. and global economies and consumer behavior and health care utilization patterns, and the timing, scope and impact of stimulus legislation and other federal, state and local governmental responses to the pandemic.
Certain additional risks and uncertainties are described in our Securities and Exchange Commission (“SEC”) filings, including those set forth in the Risk Factors section and under the heading “Cautionary Statement Concerning Forward-Looking Statements” in our most recently filed Annual Report on Form 10-K and our other filings with the SEC.
You are cautioned not to place undue reliance on CVS Health’s forward-looking statements. CVS Health’s forward-looking statements are and will be based upon management’s then-current views and assumptions regarding future events and operating performance, and are applicable only as of the dates of such statements. CVS Health does not assume any duty to update or revise forward-looking statements, whether as a result of new information, future events, uncertainties or otherwise.
– Tables Follow –
CVS HEALTH CORPORATION
Condensed Consolidated Statements of Operations
(Unaudited)
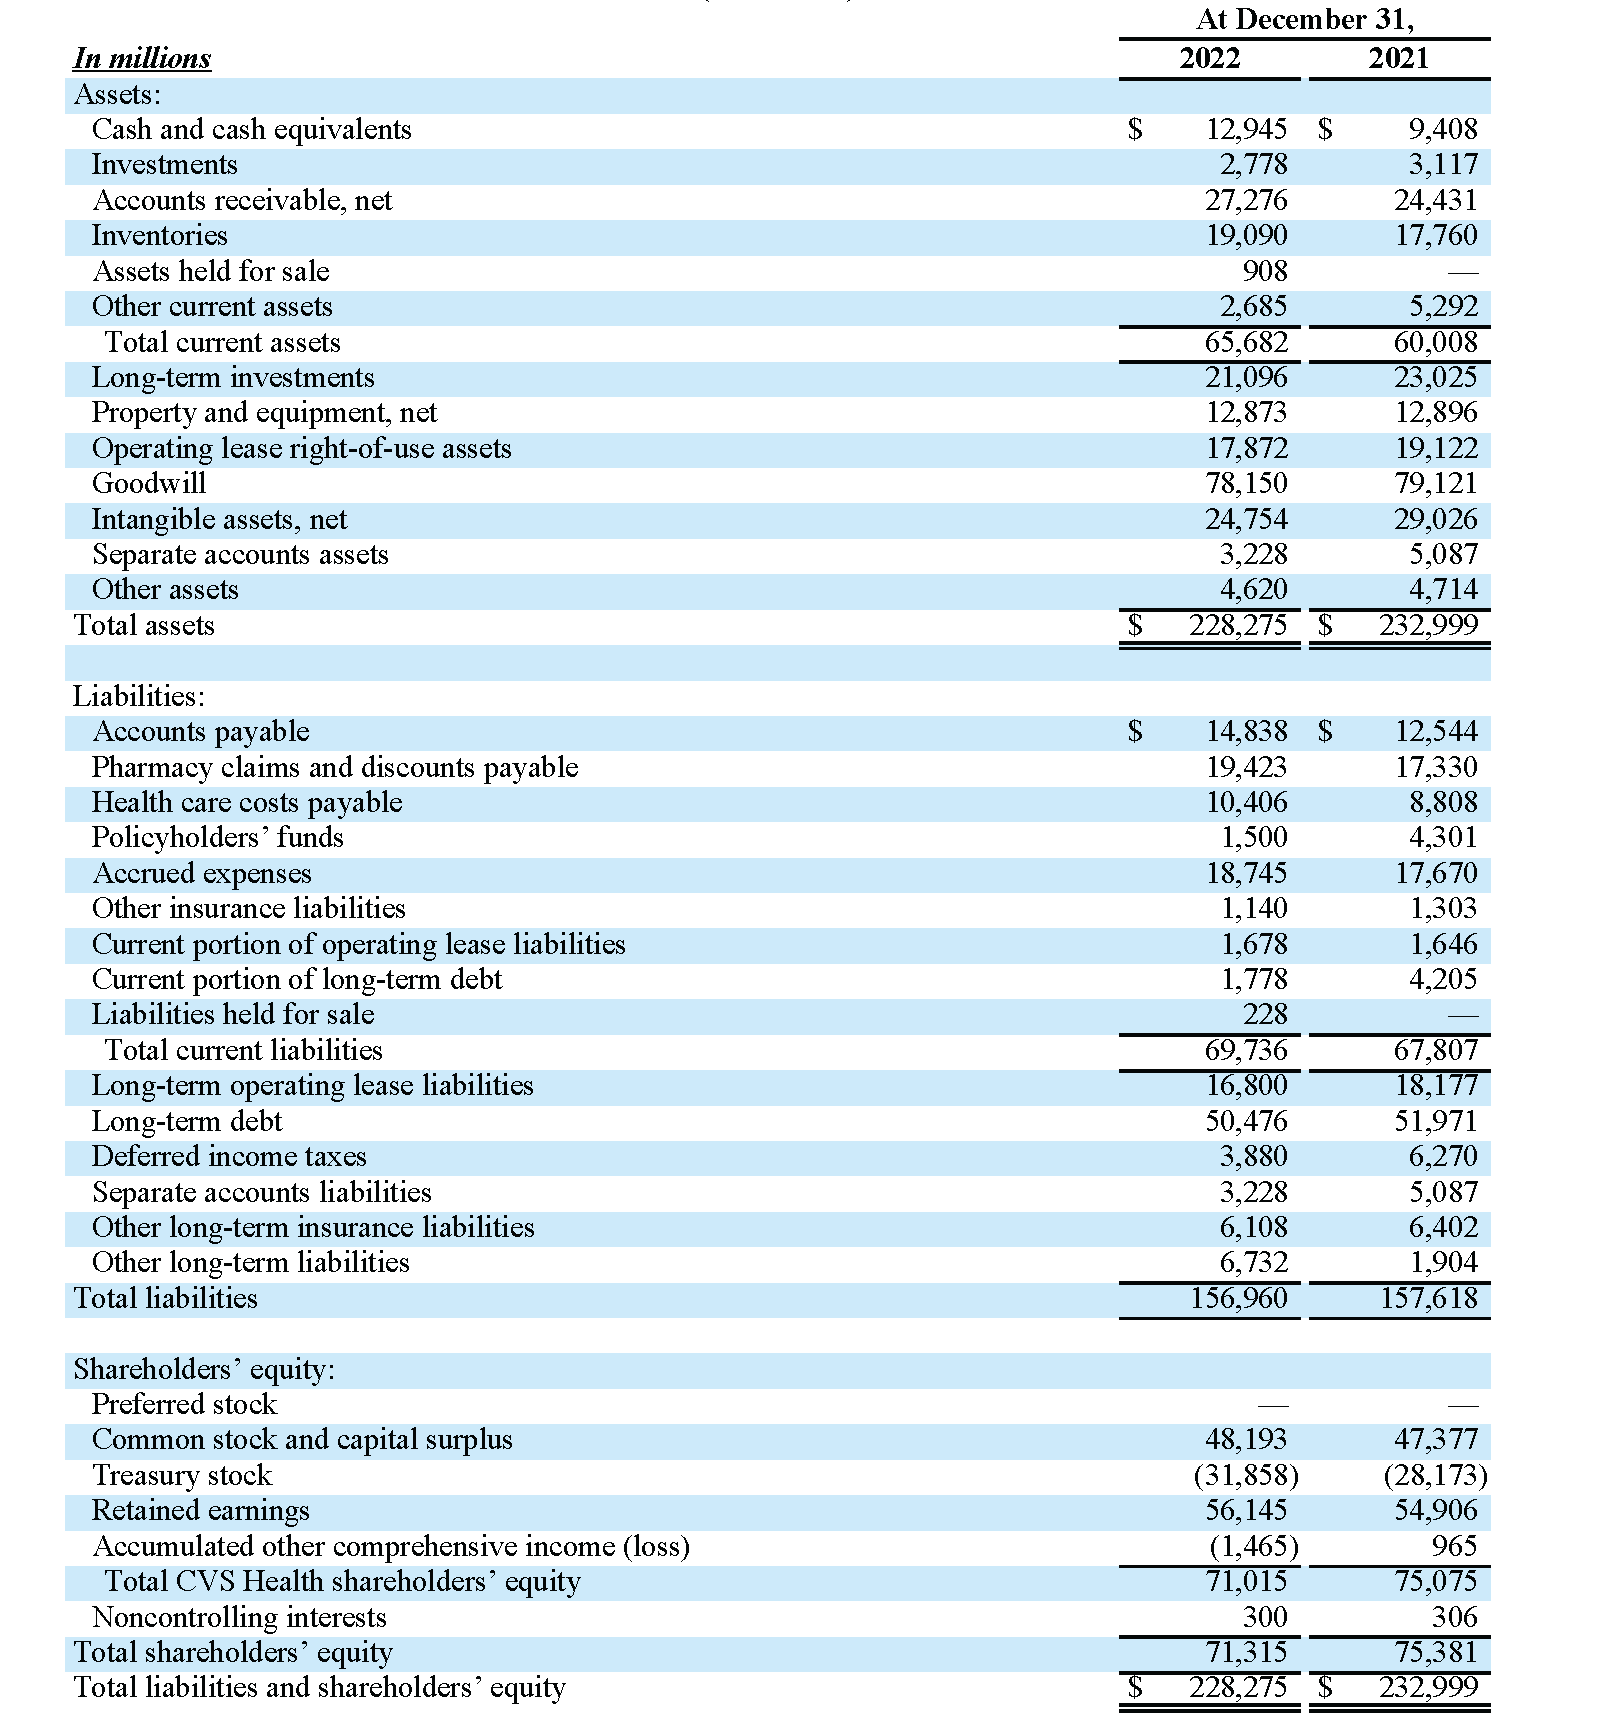
CVS HEALTH CORPORATION
Condensed Consolidated Balance Sheets
(Unaudited)
CVS HEALTH CORPORATION
Condensed Consolidated Statements of Cash Flows
(Unaudited)
CVS HEALTH CORPORATION
Condensed Consolidated Statements of Cash Flows
(Unaudited)
Non-GAAP Financial Information
The Company uses non-GAAP financial measures to analyze underlying business performance and trends. The Company believes that providing these non-GAAP financial measures enhances the Company’s and investors’ ability to compare the Company’s past financial performance with its current performance. These non-GAAP financial measures are provided as supplemental information to the financial measures presented in this press release that are calculated and presented in accordance with GAAP. Non-GAAP financial measures should not be considered a substitute for, or superior to, financial measures determined or calculated in accordance with GAAP. The Company’s definitions of its non-GAAP financial measures may not be comparable to similarly titled measures reported by other companies.
Non-GAAP financial measures such as consolidated adjusted operating income, adjusted earnings per share (EPS) and adjusted income attributable to CVS Health exclude from the relevant GAAP metrics, as applicable: amortization of intangible assets and other items, if any, that neither relate to the ordinary course of the Company’s business nor reflect the Company’s underlying business performance.
For the periods covered in this press release, the following items are excluded from the non-GAAP financial measures described above, as applicable, because the Company believes they neither relate to the ordinary course of the Company’s business nor reflect the Company’s underlying business performance:
- The Company’s acquisition activities have resulted in the recognition of intangible assets as required under the acquisition method of accounting which consist primarily of trademarks, customer contracts/relationships, covenants not to compete, technology, provider networks and value of business acquired. Definite-lived intangible assets are amortized over their estimated useful lives and are tested for impairment when events indicate that the carrying value may not be recoverable. The amortization of intangible assets is reflected in the condensed consolidated statements of operations in operating expenses within each segment. Although intangible assets contribute to the Company’s revenue generation, the amortization of intangible assets does not directly relate to the underwriting of the Company’s insurance products, the services performed for the Company’s customers or the sale of the Company’s products or services. Additionally, intangible asset amortization expense typically fluctuates based on the size and timing of the Company’s acquisition activity. Accordingly, the Company believes excluding the amortization of intangible assets enhances the Company’s and investors’ ability to compare the Company’s past financial performance with its current performance and to analyze underlying business performance and trends. Intangible asset amortization excluded from the related non-GAAP financial measure represents the entire amount recorded within the Company’s GAAP financial statements, and the revenue generated by the associated intangible assets has not been excluded from the related non-GAAP financial measure. Intangible asset amortization is excluded from the related non-GAAP financial measure because the amortization, unlike the related revenue, is not affected by operations of any particular period unless an intangible asset becomes impaired or the estimated useful life of an intangible asset is revised.
- During the three months and year ended December 31, 2022, the office real estate optimization charges primarily relate to the abandonment of leased real estate and the related right-of-use assets and property and equipment in connection with the planned reduction of corporate office real estate space in response to the Company’s new flexible work arrangement. The Company anticipates additional office real estate optimization charges will be recorded in 2023. The office real estate optimization charges are reflected in the Company’s condensed consolidated statements of operations in operating expenses within the Health Care Benefits, Corporate/Other and Pharmacy Services segments.
- During the three months and year ended December 31, 2022, the gain on divestiture of subsidiary represents the pre-tax gain on the sale of bswift, which the Company sold in November 2022. During the year ended December 31, 2022, the gain on divestiture of subsidiaries also includes the pre-tax gain on the sale of PayFlex, which the Company sold in June 2022. The gains on divestitures are reflected as a reduction of operating expenses in the Company’s condensed consolidated statements of operations within the Health Care Benefits segment.
- During the three months and year ended December 31, 2022, the opioid litigation charges relate to agreements to resolve substantially all opioid claims against the Company by certain states and governmental entities. The opioid litigation charges are reflected within the Corporate/Other segment.
- During the three months and year ended December 31, 2022, the loss on assets held for sale relates to the LTC reporting unit within the Retail/LTC segment. The Company continually evaluates its portfolio for non-strategic assets. The Company determined that its LTC business was no longer a strategic asset and during the third quarter of 2022 committed to a plan to sell the LTC business. As of September 30, 2022, the LTC business met the criteria for held-for-sale accounting and its net assets were accounted for as assets held for sale. The carrying value of the LTC business was determined to be greater than its estimated fair value less costs to sell and a loss on assets held for sale was recorded during the third quarter of 2022. As of December 31, 2022, the net assets of the LTC business continued to meet the criteria for held-for-sale accounting and during the fourth quarter of 2022, an incremental loss on assets held for sale was recorded to write down the carrying value of the LTC business to its estimated fair value less costs to sell. During the year ended December 31, 2022, the loss on assets held for sale also relates to the Commercial Business reporting unit within the Health Care Benefits segment. In March 2022, the Company reached an agreement to sell its international health care business domiciled in Thailand (“Thailand business”), which was included in the Commercial Business reporting unit. At that time, a portion of the Commercial Business goodwill was specifically allocated to the Thailand business. The net assets of the Thailand business were accounted for as assets held for sale at March 31, 2022. The carrying value of the Thailand business was determined to be greater than its estimated fair value less costs to sell and a loss on assets held for sale was recorded during the first quarter of 2022. The sale of the Thailand business closed in the second quarter of 2022, and the ultimate loss on the sale was not material.
- During the three months and year ended December 31, 2021, acquisition-related integration costs relate to the acquisition of Aetna Inc. The acquisition-related integration costs are reflected in the Company’s condensed consolidated statements of operations in operating expenses within the Corporate/Other segment.
- During the three months and year ended December 31, 2021, the store impairment charge relates to the write-down of operating lease right-of-use assets and property and equipment in connection with the planned closure of approximately 900 retail stores between 2022 and 2024. The store impairment charge is reflected within the Retail/LTC segment.
- During the year ended December 31, 2021, the goodwill impairment charge relates to an impairment of the remaining goodwill of the LTC reporting unit within the Retail/LTC segment.
- During the three months and year ended December 31, 2021, the loss on early extinguishment of debt relates to the Company’s repayment of approximately $2.3 billion of its outstanding senior notes in December 2021 pursuant to its early redemption make-whole provision for such senior notes. During the year ended December 31, 2021, the loss on early extinguishment of debt also relates to the Company’s repayment of approximately $2.0 billion of its outstanding senior notes in August 2021 pursuant to its tender offer for such senior notes.
- During the year ended December 31, 2021, the Company received $61 million related to a purchase price working capital adjustment for an acquisition completed during the first quarter of 2020. The resolution of this matter occurred subsequent to the acquisition accounting measurement period and is reflected in the Company’s condensed consolidated statement of operations as a reduction of operating expenses within the Health Care Benefits segment.
- The corresponding tax benefit or expense related to the items excluded from adjusted income attributable to CVS Health and Adjusted EPS above. The nature of each non-GAAP adjustment is evaluated to determine whether a discrete adjustment should be made to the adjusted income tax provision. During the year ended December 31, 2022, the Company’s adjusted income tax provision also excludes the impact of certain discrete tax items concluded in the first quarter of 2022. During the three months and year ended December 31, 2021, the Company’s adjusted income tax provision also excludes certain tax benefits primarily related to a prior year refund claim.
See endnotes (1) and (2) on page 25 for definitions of non-GAAP financial measures. Reconciliations of each non-GAAP financial measure to the most directly comparable GAAP financial measure are presented on pages 15 through 17 and page 24.
Reconciliations of Non-GAAP Financial Measures to the Most Directly Comparable GAAP Financial Measures
Adjusted Operating Income (Unaudited)
The following are reconciliations of consolidated operating income (GAAP measure) to consolidated adjusted operating income, as well as reconciliations of segment GAAP operating income to segment adjusted operating income:
Adjusted Earnings Per Share (Unaudited)
The following are reconciliations of net income attributable to CVS Health to adjusted income attributable to CVS Health and calculations of GAAP diluted EPS and Adjusted EPS:
Supplemental Information (Unaudited)
The Company’s segments maintain separate financial information, and the Company’s chief operating decision maker (the “CODM”) evaluates the segments’ operating results on a regular basis in deciding how to allocate resources among the segments and in assessing segment performance. The CODM evaluates the performance of the Company’s segments based on adjusted operating income, which is defined as operating income (GAAP measure) excluding the impact of amortization of intangible assets and other items, if any, that neither relate to the ordinary course of the Company’s business nor reflect the Company’s underlying business performance as further described in endnote (1). The Company uses adjusted operating income as its principal measure of segment performance as it enhances the Company’s ability to compare past financial performance with current performance and analyze underlying business performance and trends.
The following is a reconciliation of financial measures of the Company’s segments to the consolidated totals:
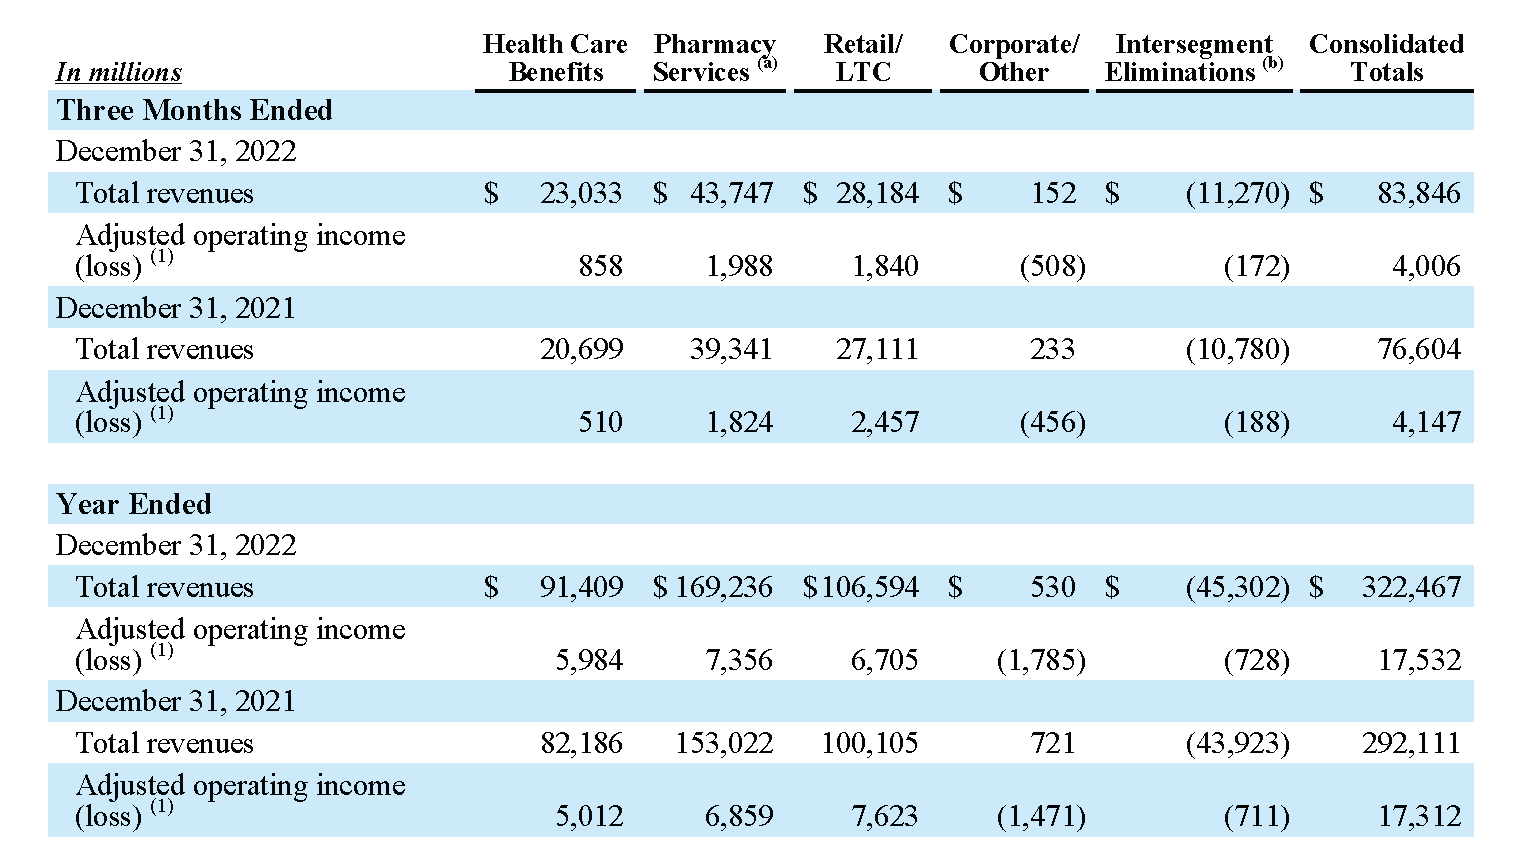
(a) Total revenues of the Pharmacy Services segment include approximately $2.8 billion and $2.6 billion of retail co-payments for the three months ended December 31, 2022 and 2021, respectively, and $12.6 billion and $11.6 billion of retail co-payments for the years ended December 31, 2022 and 2021, respectively.
(b) Intersegment revenue eliminations relate to intersegment revenue generating activities that occur between the Health Care Benefits segment, the Pharmacy Services segment, and/or the Retail/LTC segment. Intersegment adjusted operating income eliminations occur when members of Pharmacy Services segment clients enrolled in Maintenance Choice® elect to pick up maintenance prescriptions at one of the Company’s retail pharmacies instead of receiving them through the mail. When this occurs, both the Pharmacy Services and Retail/LTC segments record the adjusted operating income on a stand-alone basis.
Supplemental Information (Unaudited)
Health Care Benefits Segment
The following table summarizes the Health Care Benefits segment’s performance for the respective periods:
The following table shows the components of the change in health care costs payable during the nine months ended September 30, 2022 and 2021:
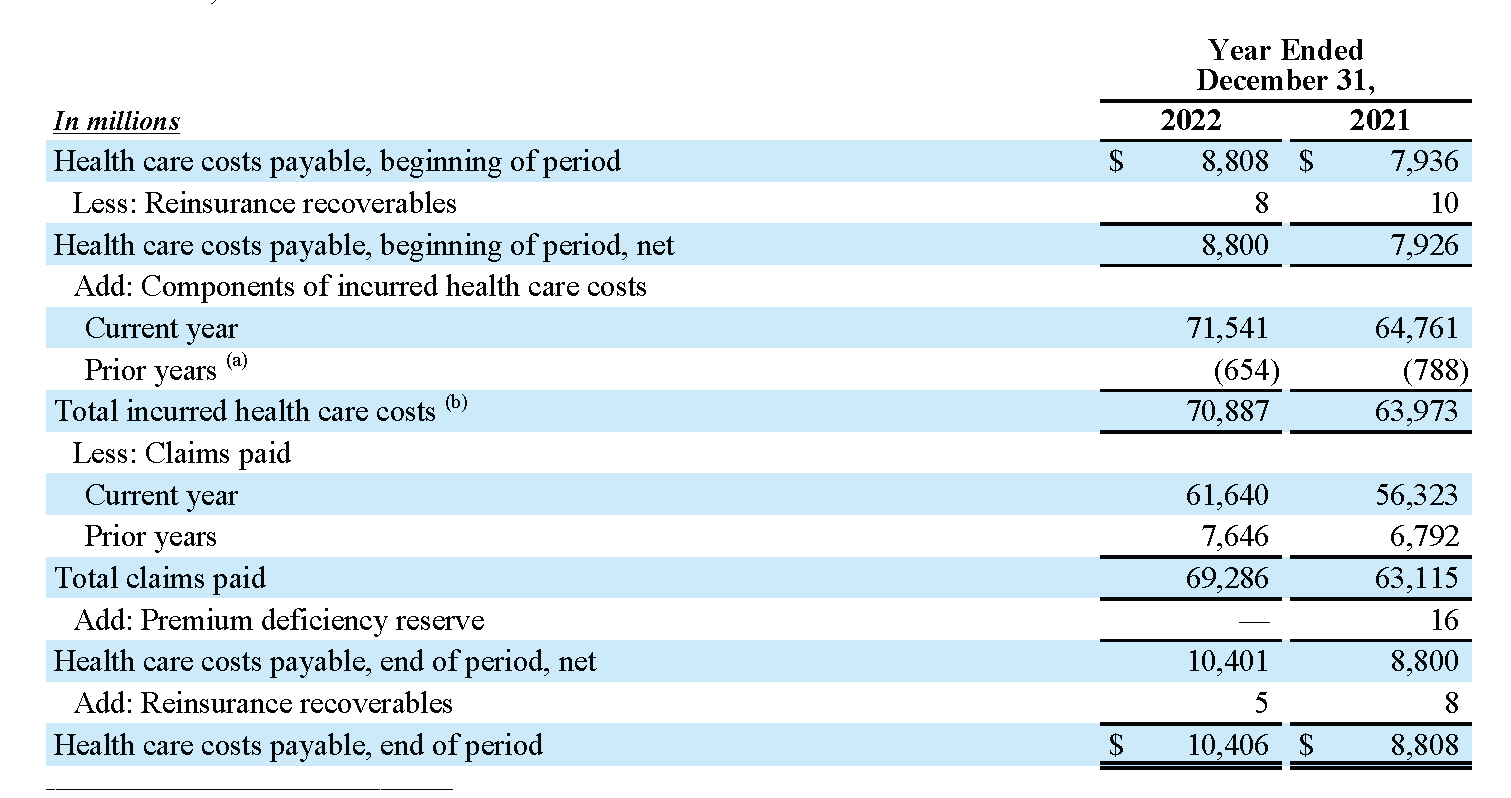
(a) Negative amounts reported for incurred health care costs related to prior years result from claims being settled for amounts less than originally estimated.
(b) Total incurred health care costs for the years ended December 31, 2022 and 2021 in the table above exclude $75 million and $59 million, respectively, of benefit costs recorded in the Health Care Benefits segment that are included in other insurance liabilities on the condensed consolidated balance sheets and $319 million and $212 million, respectively, of benefit costs recorded in the Corporate/Other segment that are included in other insurance liabilities on the condensed consolidated balance sheets. The incurred health care costs for the year ended December 31, 2021 also exclude $16 million for premium deficiency reserves related to the Company’s Medicaid products.
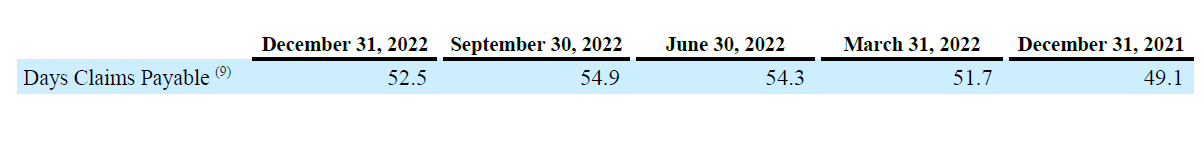
The following table summarizes the Health Care Benefits segment’s days claims payable for the respective periods:
Supplemental Information (Unaudited)
Pharmacy Services Segment
The following table summarizes the Pharmacy Services segment’s performance for the respective periods:
(a) Excluding the impact of COVID-19 vaccinations, total pharmacy claims processed increased 4.6% and 5.1%, on a 30-day equivalent basis, for the three months and year ended December 31, 2022, respectively, compared to the prior year.
(b) Excluding the impact of COVID-19 vaccinations, the Pharmacy Services segment’s total generic dispensing rate was 87.5% and 87.7% in the three months ended December 31, 2022 and 2021, respectively, and 88.3% and 88.5% in the years ended December 31, 2022 and 2021, respectively.
Supplemental Information (Unaudited)
Retail/LTC Segment
The following table summarizes the Retail/LTC segment’s performance for the respective periods:
(a) Excluding the impact of COVID-19 vaccinations, prescriptions filled increased 4.0% and 4.4%, on a 30-day equivalent basis, for the three months and year ended December 31, 2022, respectively, compared to the prior year.
(b) Excluding the impact of COVID-19 vaccinations, the Retail/LTC segment’s total generic dispensing rate was 87.6% in both the three months ended December 31, 2022 and 2021, and 89.0% in both the years ended December 31, 2022 and 2021.
Supplemental Information (Unaudited)
Corporate/Other Segment
The following table summarizes the Corporate/Other segment’s performance for the respective periods:
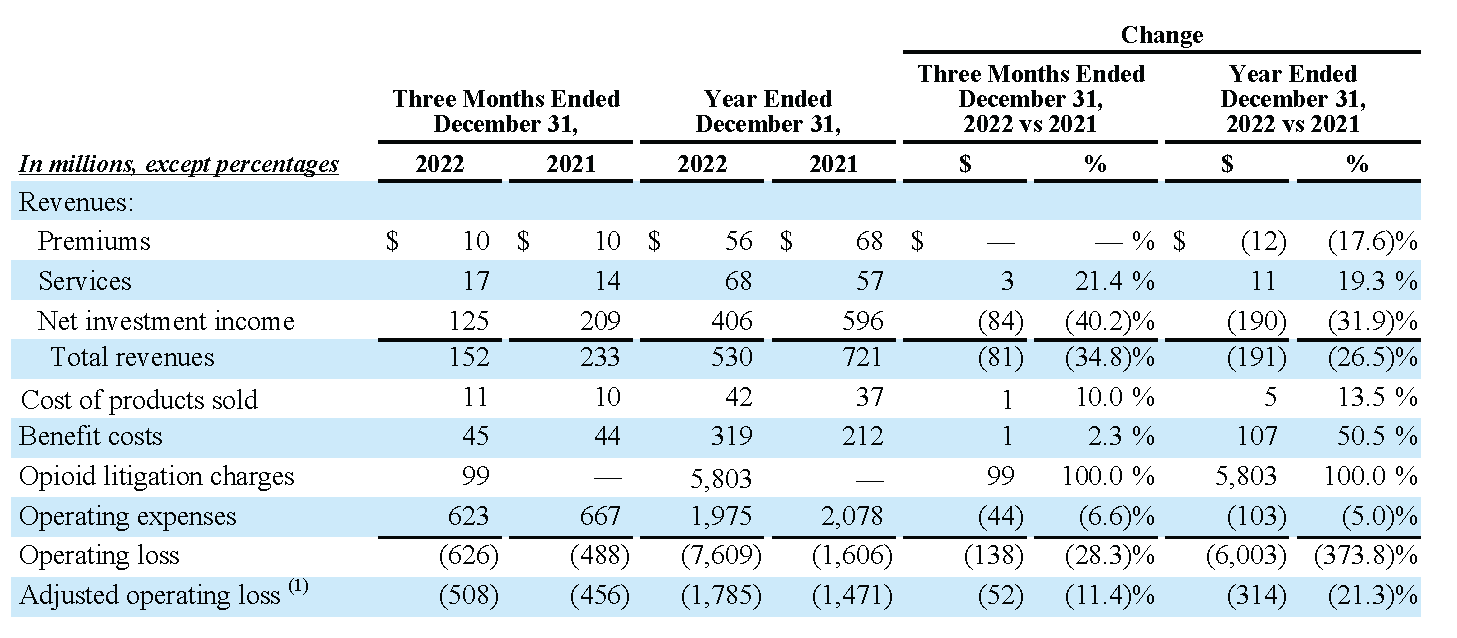
• Adjusted operating loss increased 11.4% and 21.3% for the three months and year ended December 31, 2022, respectively, compared to the prior year primarily driven by decreases in net investment income. The increase in adjusted operating loss in the year ended December 31, 2022 was also driven by the strengthening of reserves in the Company’s long-term care insurance business, which occurred during the second quarter of 2022.
Adjusted Earnings Per Share Guidance (Unaudited)
The following reconciliations of projected net income attributable to CVS Health to projected adjusted income attributable to CVS Health and calculations of projected GAAP diluted EPS and projected Adjusted EPS contain forward-looking information. All forward-looking information involves risks and uncertainties. Actual results may differ materially from those contemplated by the forward-looking information for a number of reasons as described in our SEC filings, including those set forth in the Risk Factors section and under the heading “Cautionary Statement Concerning Forward-Looking Statements” in our most recently filed Annual Report on Form 10-K and in our most recently filed Quarterly Report on Form 10-Q. See “Non-GAAP Financial Information” earlier in this press release and endnote (2) later in this press release for more information on how we calculate Adjusted EPS.
Endnotes
(1) The Company defines adjusted operating income as operating income (GAAP measure) excluding the impact of amortization of intangible assets and other items, if any, that neither relate to the ordinary course of the Company’s business nor reflect the Company’s underlying business performance, such as office real estate optimization charges, gains/losses on divestitures, opioid litigation charges, losses on assets held for sale, acquisition-related integration costs, store impairments, goodwill impairments and acquisition purchase price adjustments outside of the acquisition accounting measurement period. The Company uses adjusted operating income as its principal measure of segment performance as it enhances the Company’s ability to compare past financial performance with current performance and analyze underlying business performance and trends. The consolidated measure is not determined in accordance with GAAP and should not be considered a substitute for, or superior to, the most directly comparable GAAP measure, consolidated operating income. See “Non-GAAP Financial Information” earlier in this press release for additional information regarding the items excluded from consolidated operating income in determining consolidated adjusted operating income.
(2) Adjusted EPS is calculated by dividing adjusted income attributable to CVS Health by the Company’s weighted average diluted shares outstanding. The Company defines adjusted income attributable to CVS Health as net income attributable to CVS Health (GAAP measure) excluding the impact of amortization of intangible assets and other items, if any, that neither relate to the ordinary course of the Company’s business nor reflect the Company’s underlying business performance, such as office real estate optimization charges, gains/losses on divestitures, opioid litigation charges, losses on assets held for sale, acquisition-related integration costs, store impairments, goodwill impairments, acquisition purchase price adjustments outside of the acquisition accounting measurement period, losses on early extinguishment of debt, as well as the corresponding income tax benefit or expense related to the items excluded from adjusted income attributable to CVS Health and certain discrete tax items. See “Non-GAAP Financial Information” earlier in this press release for additional information regarding the items excluded from net income attributable to CVS Health in determining adjusted income attributable to CVS Health.
(3) Medical benefit ratio is calculated as benefit costs divided by premium revenues and represents the percentage of premium revenues spent on medical benefits for the Company’s insured members. Management uses MBR to assess the underlying business performance and underwriting of its insurance products, understand variances between actual results and expected results and identify trends in period-over-period results. MBR provides management and investors with information useful in assessing the operating results of the Company’s insured Health Care Benefits products.
(4) Medical membership represents the number of members covered by the Company’s insured and ASC medical products and related services at a specified point in time. Management uses this metric to understand variances between actual medical membership and expected amounts as well as trends in period-over-period results. This metric provides management and investors with information useful in understanding the impact of medical membership on segment total revenues and operating results.
(5) Total pharmacy claims processed represents the number of prescription claims processed through the Company’s pharmacy benefits manager and dispensed by either its retail network pharmacies or its own mail and specialty pharmacies. Prescriptions filled represents the number of prescriptions dispensed through the Retail/LTC segment’s pharmacies. Management uses these metrics to understand variances between actual claims processed and prescriptions dispensed, respectively, and expected amounts as well as trends in period-over-period results. These metrics provide management and investors with information useful in understanding the impact of pharmacy claim volume and prescription volume, respectively, on segment total revenues and operating results.
(6) Includes an adjustment to convert 90-day prescriptions to the equivalent of three 30-day prescriptions. This adjustment reflects the fact that these prescriptions include approximately three times the amount of product days supplied compared to a normal prescription.
(7) Pharmacy network is defined as claims filled at retail and specialty retail pharmacies, including the Company’s retail pharmacies and long-term care pharmacies, but excluding Maintenance Choice activity, which is included within the mail choice category. Maintenance Choice permits eligible client plan members to fill their maintenance prescriptions through mail order delivery or at a CVS pharmacy retail store for the same price as mail order.
(8) Mail choice is defined as claims filled at a Pharmacy Services mail order facility, which includes specialty mail claims inclusive of Specialty Connect® claims picked up at a retail pharmacy, as well as prescriptions filled at the Company’s retail pharmacies under the Maintenance Choice program.
(9) Days claims payable is calculated by dividing the health care costs payable at the end of each quarter by the average health care costs per day during such quarter. Management and investors use this metric as an indicator of the adequacy of the Company’s health care costs payable liability at the end of each quarter and as an indicator of changes in such adequacy over time.
(10) Gross profit is calculated as the segment’s total revenues less its cost of products sold. Gross margin is calculated by dividing the segment’s gross profit by its total revenues and represents the percentage of total revenues that remains after incurring direct costs associated with the segment’s products sold and services provided. Gross margin provides investors with information that may be useful in assessing the operating results of the Company’s Pharmacy Services and Retail/LTC segments.
(11) Generic dispensing rate is calculated by dividing the segment’s generic drug prescriptions processed or filled by its total prescriptions processed or filled. Management uses this metric to evaluate the effectiveness of the business at encouraging the use of generic drugs when they are available and clinically appropriate, which aids in decreasing costs for client members and retail customers. This metric provides management and investors with information useful in understanding trends in segment total revenues and operating results.
(12) Same store sales and prescription volume represent the change in revenues and prescriptions filled in the Company’s retail pharmacy stores that have been operating for greater than one year, expressed as a percentage that indicates the increase or decrease relative to the comparable prior period. Same store metrics exclude revenues from MinuteClinic and revenues and prescriptions from LTC operations. Management uses these metrics to evaluate the performance of existing stores on a comparable basis and to inform future decisions regarding existing stores and new locations. Same-store metrics provide management and investors with information useful in understanding the portion of current revenues and prescriptions resulting from organic growth in existing locations versus the portion resulting from opening new stores.